CPI analysis limits to account for
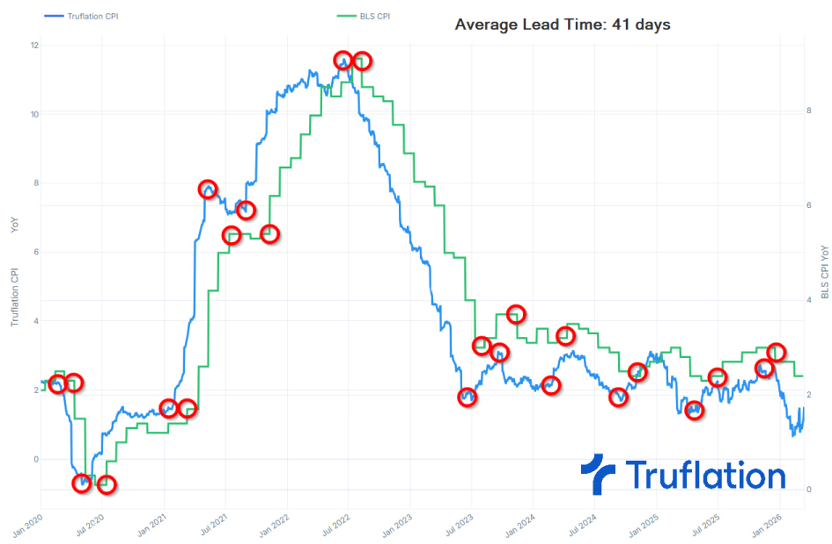
CPI data is a lagging indicator, reflecting price changes that have already occurred rather than predicting future moves. The Bureau of Labor Statistics releases the Consumer Price Index for All Urban Consumers (CPIAUCSL) monthly, typically around the middle of the following month. This delay creates a fundamental constraint: by the time you analyze the headline number, markets have often already priced in expectations based on earlier signals like the PPI or wage growth data.
The primary challenge in CPI analysis is distinguishing between headline inflation and core inflation. Headline CPI includes volatile food and energy prices, which can spike due to temporary supply shocks or seasonal factors. Core CPI, which excludes these items, provides a clearer picture of underlying inflation trends. Relying solely on headline figures can lead to false signals, especially during periods of energy price volatility.
Another constraint is the composition of the "market basket." The agency updates the weights of goods and services periodically to reflect changing consumer spending habits. However, these updates lag behind real-time shifts in behavior, such as the rapid adoption of new technologies or changes in housing costs. This means CPI may not fully capture the cost pressures experienced by specific demographics or sectors in the present moment.
To navigate these constraints, analysts should cross-reference CPI with real-time indicators. Use the TechnicalChart below to track the CPIAUCSL trend against broader market indices. This helps contextualize whether inflationary pressures are translating into equity or bond market movements. Always verify the latest release date on the BLS website to ensure you are working with the most current data before making strategic decisions.
CPI analysis choices that change the plan
When analyzing CPI data, you are rarely looking at a single number. The agency releases several variations, each with distinct strengths and weaknesses. Choosing the wrong metric can skew your market outlook, especially when the headline number contradicts the underlying trend.
The core tradeoff lies between Headline CPI and Core CPI. Headline includes all items, capturing the full volatility of energy and food. Core strips these out, offering a clearer view of persistent inflation. If energy prices spike due to a supply shock, Headline CPI rises while Core remains stable. You must decide which signal matters more for your specific asset class.
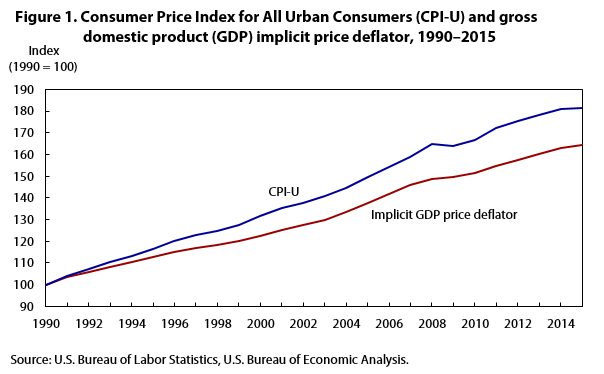
Another critical decision involves CPI-U versus C-CPI-U. The standard CPI-U covers all urban consumers. The Chained CPI (C-CPI-U) accounts for substitution behavior, where consumers switch to cheaper alternatives as prices rise. C-CPI-U typically runs lower than CPI-U. For long-term bond investors, the difference matters; for short-term traders, the headline volatility often dominates.
Data Source Comparison
| Metric | Scope | Volatility | Best Use Case |
|---|---|---|---|
| Headline CPI-U | All urban consumers, all goods | High | Short-term trading, broad inflation gauge |
| Core CPI-U | Excludes food and energy | Low | Long-term trend analysis, Fed policy |
| Chained CPI-U | Substitution-adjusted basket | Low | Bond yield forecasting, cost-of-living |
Key Tradeoff Factors
- Volatility vs. Signal: Headline CPI reacts instantly to oil shocks. Core CPI provides a smoother trend but may miss immediate inflationary pressures. Use Headline for tactical entries and Core for strategic positioning.
- Substitution Effects: C-CPI-U reflects real-world consumer behavior more accurately over time. It is less useful for immediate market reactions but better for structural economic analysis.
- Base Effects: Comparing current CPI to the same month last year can distort data if the prior year had unusual price swings. Look at month-over-month changes for a clearer picture of current momentum.
| Metric | Scope | Volatility | Best Use Case |
|---|---|---|---|
| Headline CPI-U | All urban consumers | High | Short-term trading |
| Core CPI-U | Excludes food/energy | Low | Long-term trends |
| Chained CPI-U | Substitution-adjusted | Low | Bond forecasting |
Turn CPI data into a trading decision framework
Raw CPI numbers mean little without context. To leverage data infrastructure for strategic market research, you must move from headline reading to structural analysis. This section outlines how to process CPI releases into actionable market signals, avoiding common interpretation traps.
Step 1: Separate headline from core CPI
Headline CPI includes volatile food and energy prices that often create noise rather than signal. For strategic positioning, core CPI (excluding food and energy) is the more reliable indicator of underlying inflation trends. The Federal Reserve focuses heavily on core metrics when setting policy, making it the primary driver of interest rate expectations.
Compare the headline and core percentages side-by-side. A wide gap suggests temporary supply shocks (like oil spikes) rather than persistent inflation. If both are rising, inflationary pressure is broad-based and likely to trigger tighter monetary policy.
Step 2: Analyze the "sticky" services sector
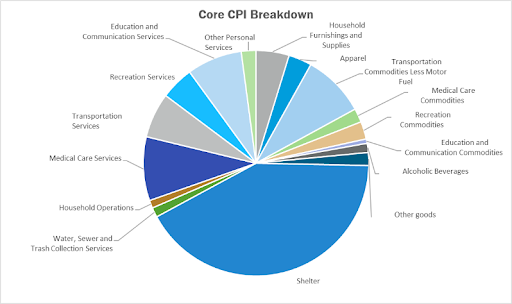
Housing and services make up the largest portion of the CPI basket and are the hardest to disinflation. Look specifically at shelter costs and wages in service industries. These components tend to lag the broader economy, meaning they often remain elevated even after headline inflation cools.
If services inflation remains above 3-4%, the Fed is unlikely to cut rates aggressively. High wage growth in this sector suggests businesses can pass costs to consumers, sustaining price hikes. This environment typically favors defensive stocks and bonds over speculative growth assets.
Step 3: Gauge market reaction vs. expectations
Markets price in expectations before the release. The actual impact on assets depends on the surprise factor. Use a TechnicalChart to visualize the immediate volatility in the S&P 500, Treasury yields, and the Dollar Index (DXY) post-release. A "hot" print that matches forecasts often causes less volatility than a surprise.
If 10-year Treasury yields spike after a hot CPI print, equity markets often sell off due to higher discount rates. Conversely, a "cold" print that lowers yields can trigger a risk-on rally. Always compare the actual release to the Bloomberg or Reuters consensus forecast to gauge the surprise.
Step 4: Identify the strategic asset allocation shift
Based on the previous steps, map the CPI data to specific asset classes. High core CPI and sticky services suggest a "higher for longer" rate environment. This typically hurts long-duration bonds and unprofitable tech stocks, while benefiting financials and value sectors.
If inflation is persistent, consider increasing exposure to commodities or TIPS (Treasury Inflation-Protected Securities). If inflation is cooling as expected, prepare for a rotation back into growth stocks as rate cut expectations rise. Use the ComparisonTable below to quickly reference historical CPI impacts.
| CPI Scenario | Equity Impact | Bond Impact | USD Impact |
|---|---|---|---|
| Hot CPI (Above Expectations) | Bearish | Bearish (Yields Up) | Bullish |
| Cool CPI (Below Expectations) | Bullish | Bullish (Yields Down) | Bearish |
| In-Line CPI | Neutral/Volatile | Neutral | Neutral |
Always cross-reference initial estimates with the final release from the BLS. Initial reports are often revised. For real-time tracking, use FRED (Federal Reserve Economic Data) to monitor the CPIAUCSL series. Relying on delayed or secondary sources can lead to mispriced positions.
Spotting Misleading CPI Claims
Market commentary often treats the Consumer Price Index as a simple binary signal. This approach ignores the structural complexity of the data and leads to costly misinterpretations. The agency publishes raw figures, but deriving actionable intelligence requires distinguishing between headline noise and underlying trends.
Headline vs. Core Inflation
The headline CPI includes volatile food and energy prices, which can spike due to temporary supply shocks rather than sustained demand pressure. Relying solely on this figure creates false volatility signals. Core CPI excludes these categories to reveal the persistent inflation trend. Traders who ignore the divergence between headline and core metrics often mistake temporary price spikes for structural inflation.
Seasonal Adjustments
Data released monthly is seasonally adjusted to account for predictable patterns like holiday spending or summer travel. These adjustments are estimates, not fixed constants. When actual seasonal patterns deviate significantly from historical norms, the adjustment can mask true momentum. Always compare the raw, unadjusted data against the seasonal model to verify if the trend is genuine or an artifact of the calculation.
Weighting Distortions
The CPI basket weights reflect average urban consumer spending, which may not match your specific market exposure. Housing costs, for example, carry a heavy weight that can dominate the index even if other sectors are stable. If your investment thesis relies on broad economic health, a housing-driven CPI surge might be misleading. Check the sub-components to see if the rise is broad-based or concentrated in a single sector.
The Lag Trap
CPI is a backward-looking indicator. By the time the data is released, market participants have often already priced in the expectations. Trading the release itself is rarely profitable unless the deviation from consensus is massive. The real value lies in using the data to update your long-term inflation assumptions, not to time short-term trades.
CPI analysis: what to check next
Data infrastructure turns raw numbers into actionable market signals. Before you adjust your trading positions, clarify what the latest release actually means for your strategy.
No comments yet. Be the first to share your thoughts!