What the CPI actually measures
The Consumer Price Index (CPI) is a statistical estimate of the average change over time in the prices paid by urban consumers for a market basket of consumer goods and services. It is not a measure of corporate earnings, stock market performance, or national wealth. Instead, it is a thermometer for the cost of living, tracking the specific prices of everyday items like food, energy, housing, and medical care.
Think of the CPI as a fixed shopping cart. The government selects a representative list of goods and services that a typical household would buy. Each month, they record the price of every item in that cart. If the total cost of the cart is higher than it was last month, inflation is occurring. If the cost is lower, deflation is occurring. This mechanism isolates price changes from changes in consumer behavior or product quality.
The Bureau of Labor Statistics (BLS) calculates the CPI by gathering price data from thousands of selected retail and service establishments across the United States. The resulting index number allows economists, policymakers, and investors to gauge the purchasing power of the dollar. A rising CPI indicates that each dollar buys fewer goods and services, which is the definition of inflation.
Understanding this distinction is critical for market strategy. Investors often confuse stock market returns with real economic growth. However, the CPI provides the baseline for adjusting nominal returns into real returns. Without accurate CPI data, it is impossible to determine whether an investment is truly outpacing the rising cost of living.
How CPI Data Drives Market Volatility
The Consumer Price Index acts as the central nervous system for global markets. When the Bureau of Labor Statistics releases CPI data, it does not merely report past prices; it recalibrates the market's expectations for future Federal Reserve policy. This shift in expectations triggers immediate repricing across asset classes, moving capital from growth-oriented equities to fixed income or defensive sectors depending on the deviation from consensus forecasts.
Bond yields are the first to react. The 10-year Treasury yield often spikes if CPI comes in hotter than expected, as traders price in higher-for-longer interest rates. This rise in yields increases the discount rate for future corporate earnings, disproportionately hurting high-multiple technology and growth stocks. Conversely, a cooler CPI print can send yields tumbling, providing a tailwind for equity valuations.
Equity sector rotation follows the bond market's lead. When inflation pressures mount, investors typically rotate out of discretionary consumer stocks and into staples or energy, which benefit from or are less sensitive to rising prices. This mechanism turns a single monthly data point into a catalyst for broad portfolio rebalancing.

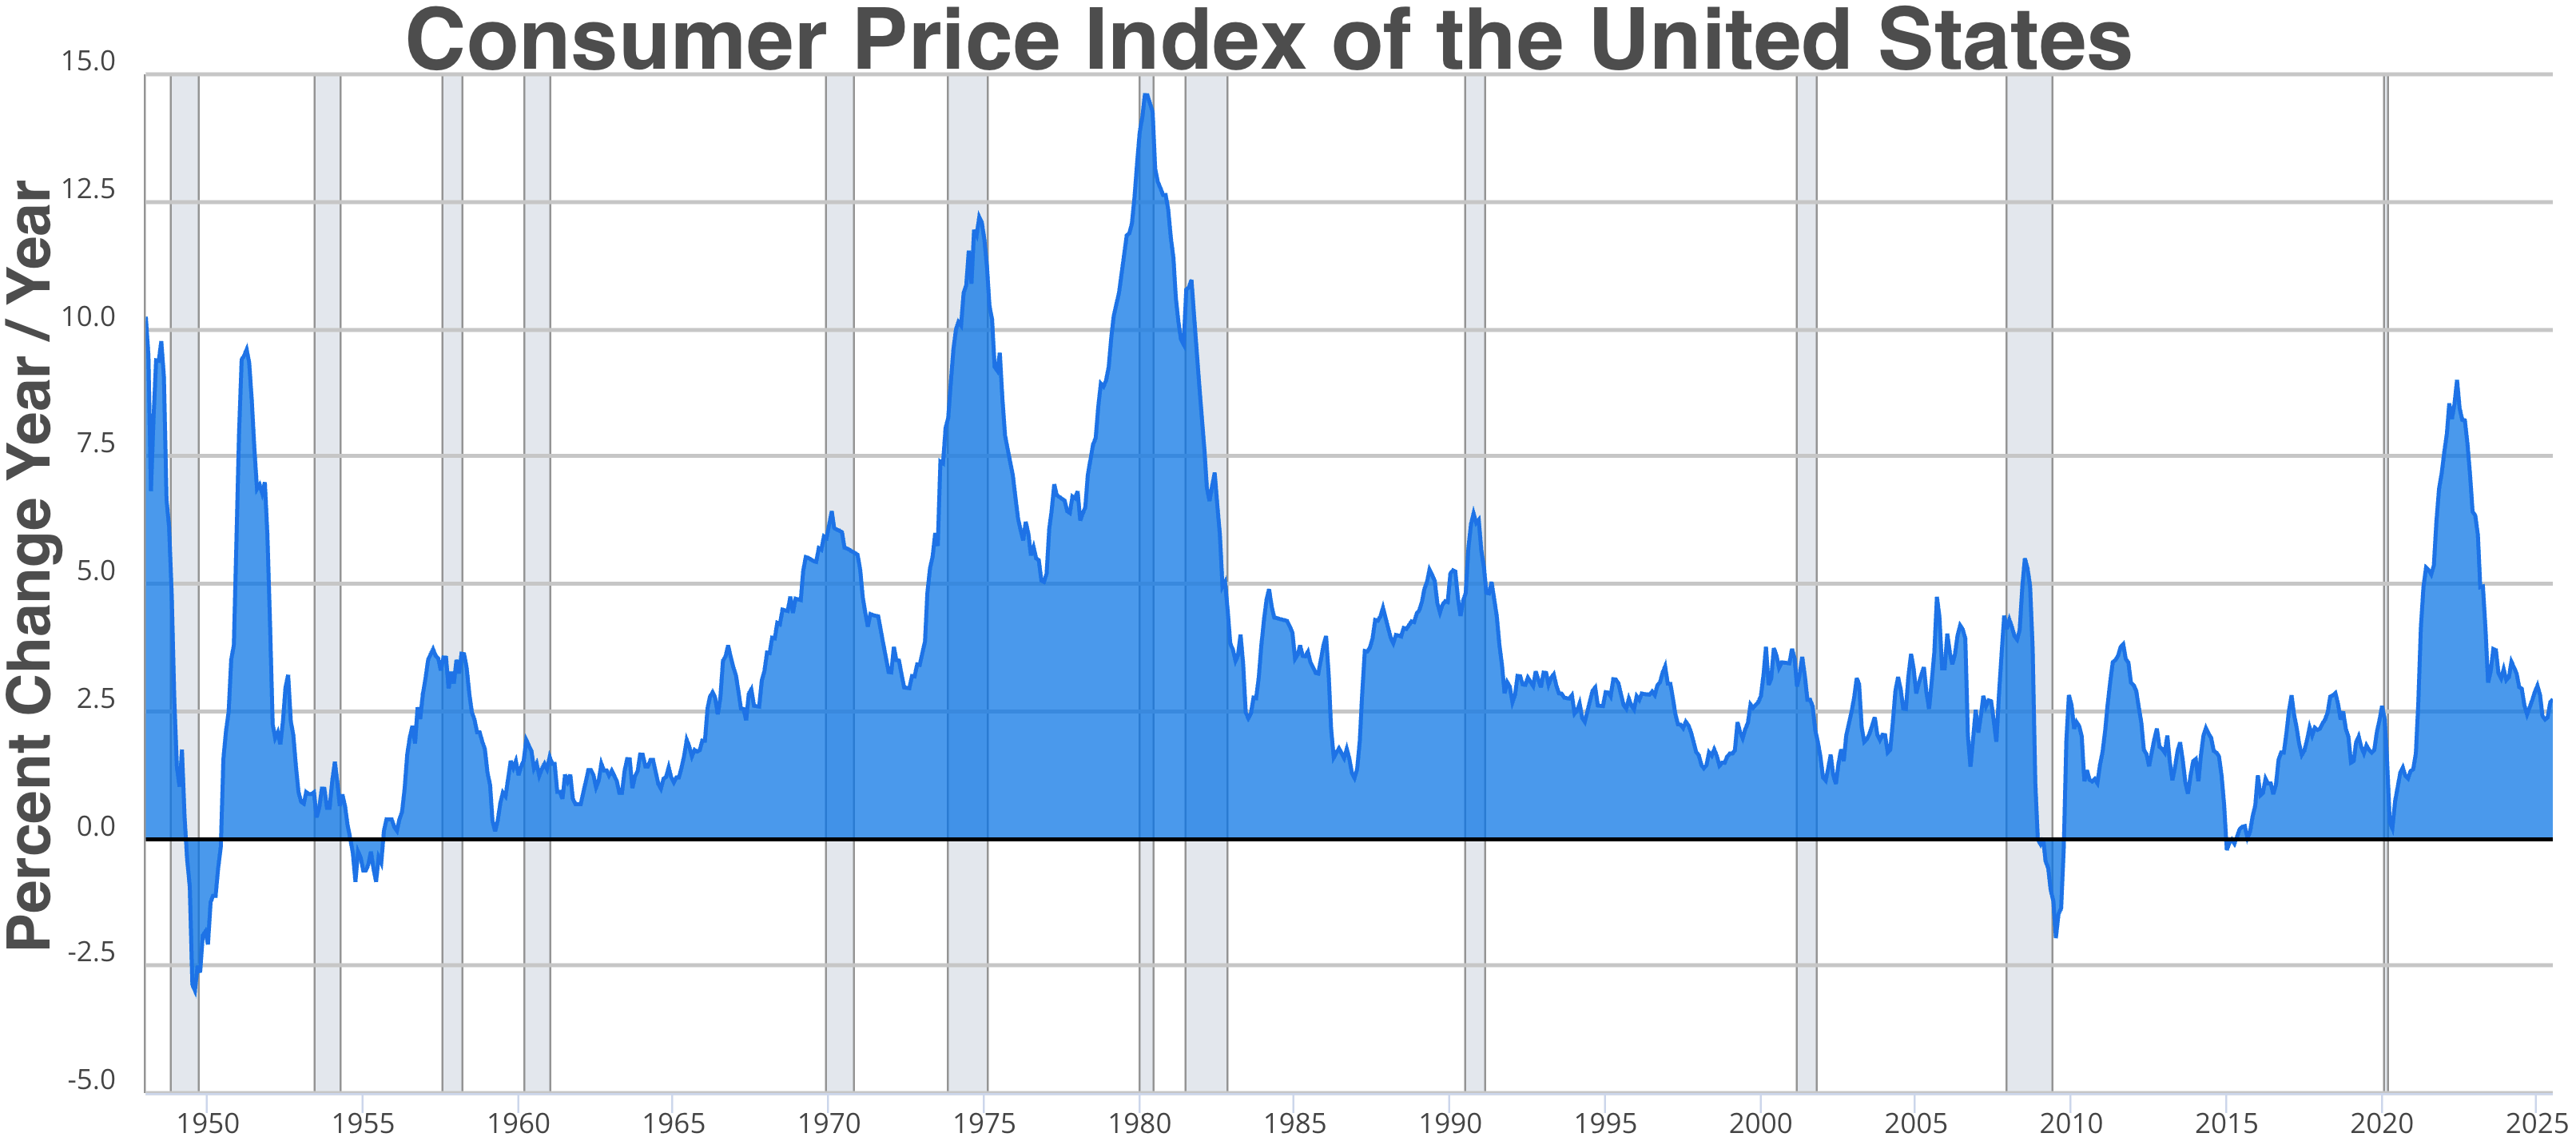
Technical analysis of the S&P 500 relative to Treasury yields often reveals these causal links. Traders watch the correlation between CPI surprises and index volatility to time entries and exits. The chart below illustrates how CPI release dates frequently align with sharp divergences in market direction.
Core CPI vs headline inflation differences
The CPI works best as a clear sequence: define the constraint, compare the realistic options, test the tradeoff, and choose the path with the fewest hidden costs. That order keeps the advice usable instead of decorative. After each step, pause long enough to check whether the recommendation still fits the reader's actual situation. If it depends on perfect timing, unusual access, or a best-case budget, include a simpler fallback.
| Factor | What to check | Why it matters |
|---|---|---|
| Fit | Match the option to the primary use case. | A good deal still fails if it does not fit the job. |
| Condition | Verify age, wear, and service history. | Hidden condition issues erase upfront savings. |
| Cost | Compare purchase price with likely upkeep. | The cheapest option is not always the lowest-cost option. |
Using CPI trends for asset allocation
The CPI works best as a clear sequence: define the constraint, compare the realistic options, test the tradeoff, and choose the path with the fewest hidden costs. That order keeps the advice usable instead of decorative. After each step, pause long enough to check whether the recommendation still fits the reader's actual situation. If it depends on perfect timing, unusual access, or a best-case budget, include a simpler fallback.


Common questions about CPI data
Understanding the Consumer Price Index requires separating the raw data from its broader economic implications. These answers address frequent search queries to clarify definitions and current trends for market strategy.
No comments yet. Be the first to share your thoughts!