Understand the CPI release schedule
The Consumer Price Index (CPI) data from the U.S. Bureau of Labor Statistics (BLS) drops on a predictable schedule, typically between the 10th and 15th of each month for the previous month’s data. This timing is critical for crypto traders because Bitcoin and other digital assets often react sharply to inflation signals within minutes of the release. Unlike stock earnings reports, which can happen any day, CPI follows a rigid calendar that you can plan around.
The agency releases the headline CPI number at 8:30 AM Eastern Time on the scheduled day. This single number often triggers immediate volatility in crypto markets as algorithmic traders and institutional investors adjust their positions based on whether inflation is cooling or heating up. If the data comes in higher than expected, it typically signals that the Federal Reserve may keep interest rates higher for longer, which can pressure risk assets. Conversely, lower-than-expected figures often boost crypto prices as they suggest easing inflationary pressures.
To stay ahead of the market, monitor the economic calendar from reputable sources like Investing.com or the BLS website itself. Mark your calendar for the specific release dates, and be aware that revisions to prior months’ data can also impact sentiment. Understanding this rhythm helps you avoid being caught off guard by sudden price swings and allows you to prepare your trading strategy in advance.
Find the official CPI sources
When you are tracking how inflation data moves crypto markets, the quality of your data matters more than the speed of your reaction. Relying on third-party summaries or delayed news feeds introduces noise that can distort your view of the market's true drivers. You need the raw numbers directly from the agencies that collect and calculate them.
The primary source for U.S. inflation data is the Bureau of Labor Statistics. Their Consumer Price Index page provides the official release schedule, detailed methodology, and the raw tables that financial analysts use to build their models. This is the definitive record of price changes for urban consumers. If you want to understand the mechanics behind the headline number, the BLS site is where you start.
For historical context and charting, the Federal Reserve Economic Data (FRED) platform is the standard tool. FRED aggregates BLS data into accessible time-series graphs, allowing you to visualize long-term trends alongside crypto price action. The series code CPIAUCSL (Consumer Price Index for All Urban Consumers, Seasonally Adjusted) is the most commonly referenced metric in macroeconomic discussions. Using FRED helps you spot the lag between inflation shifts and market reactions over months or years, rather than just the immediate daily volatility.
Starting with these official channels ensures your analysis is built on verified figures. It removes the guesswork of interpreting secondary reports and gives you a clear, unfiltered view of the inflation data that influences investor sentiment in digital asset markets.
Run your CPI analysis workflow
Reading CPI data isn't about memorizing definitions; it's about spotting the gap between what the market expected and what actually happened. That gap drives volatility. When headline numbers miss consensus, crypto markets often react sharply, especially Bitcoin, which has increasingly correlated with macro liquidity signals.
Follow this four-step sequence to interpret the release correctly. Do not trade on the first number you see. Wait for the breakdown.
Before the release, know the baseline. The agency releases data at 8:30 AM ET, but traders have been pricing in expectations for days. Check the consensus median from major financial terminals or the BLS's own preview summaries.
If the consensus is 0.3% month-over-month (MoM) and the actual print is 0.3%, the market may barely move. Volatility spikes when the actual number deviates significantly from this forecast. Note the direction: is the consensus higher or lower than last month's print? This sets the momentum context.
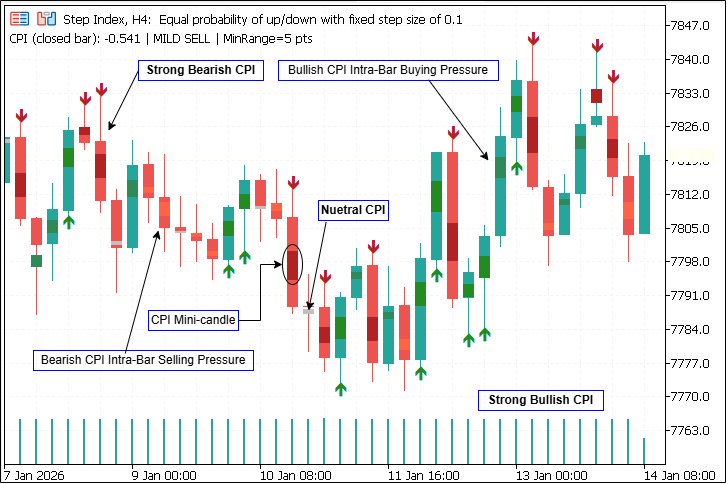
Headline CPI includes all items, notably food and energy. It is the most widely watched metric because it reflects the immediate cost of living. However, it is also the most volatile.
Look at the MoM and Year-over-Year (YoY) figures. A headline miss can trigger immediate algorithmic selling in crypto if it signals persistent inflation. But headline alone is misleading. A high headline number might just be a spike in used car prices or shelter costs that are already priced in. Always read the headline number alongside the consensus deviation.

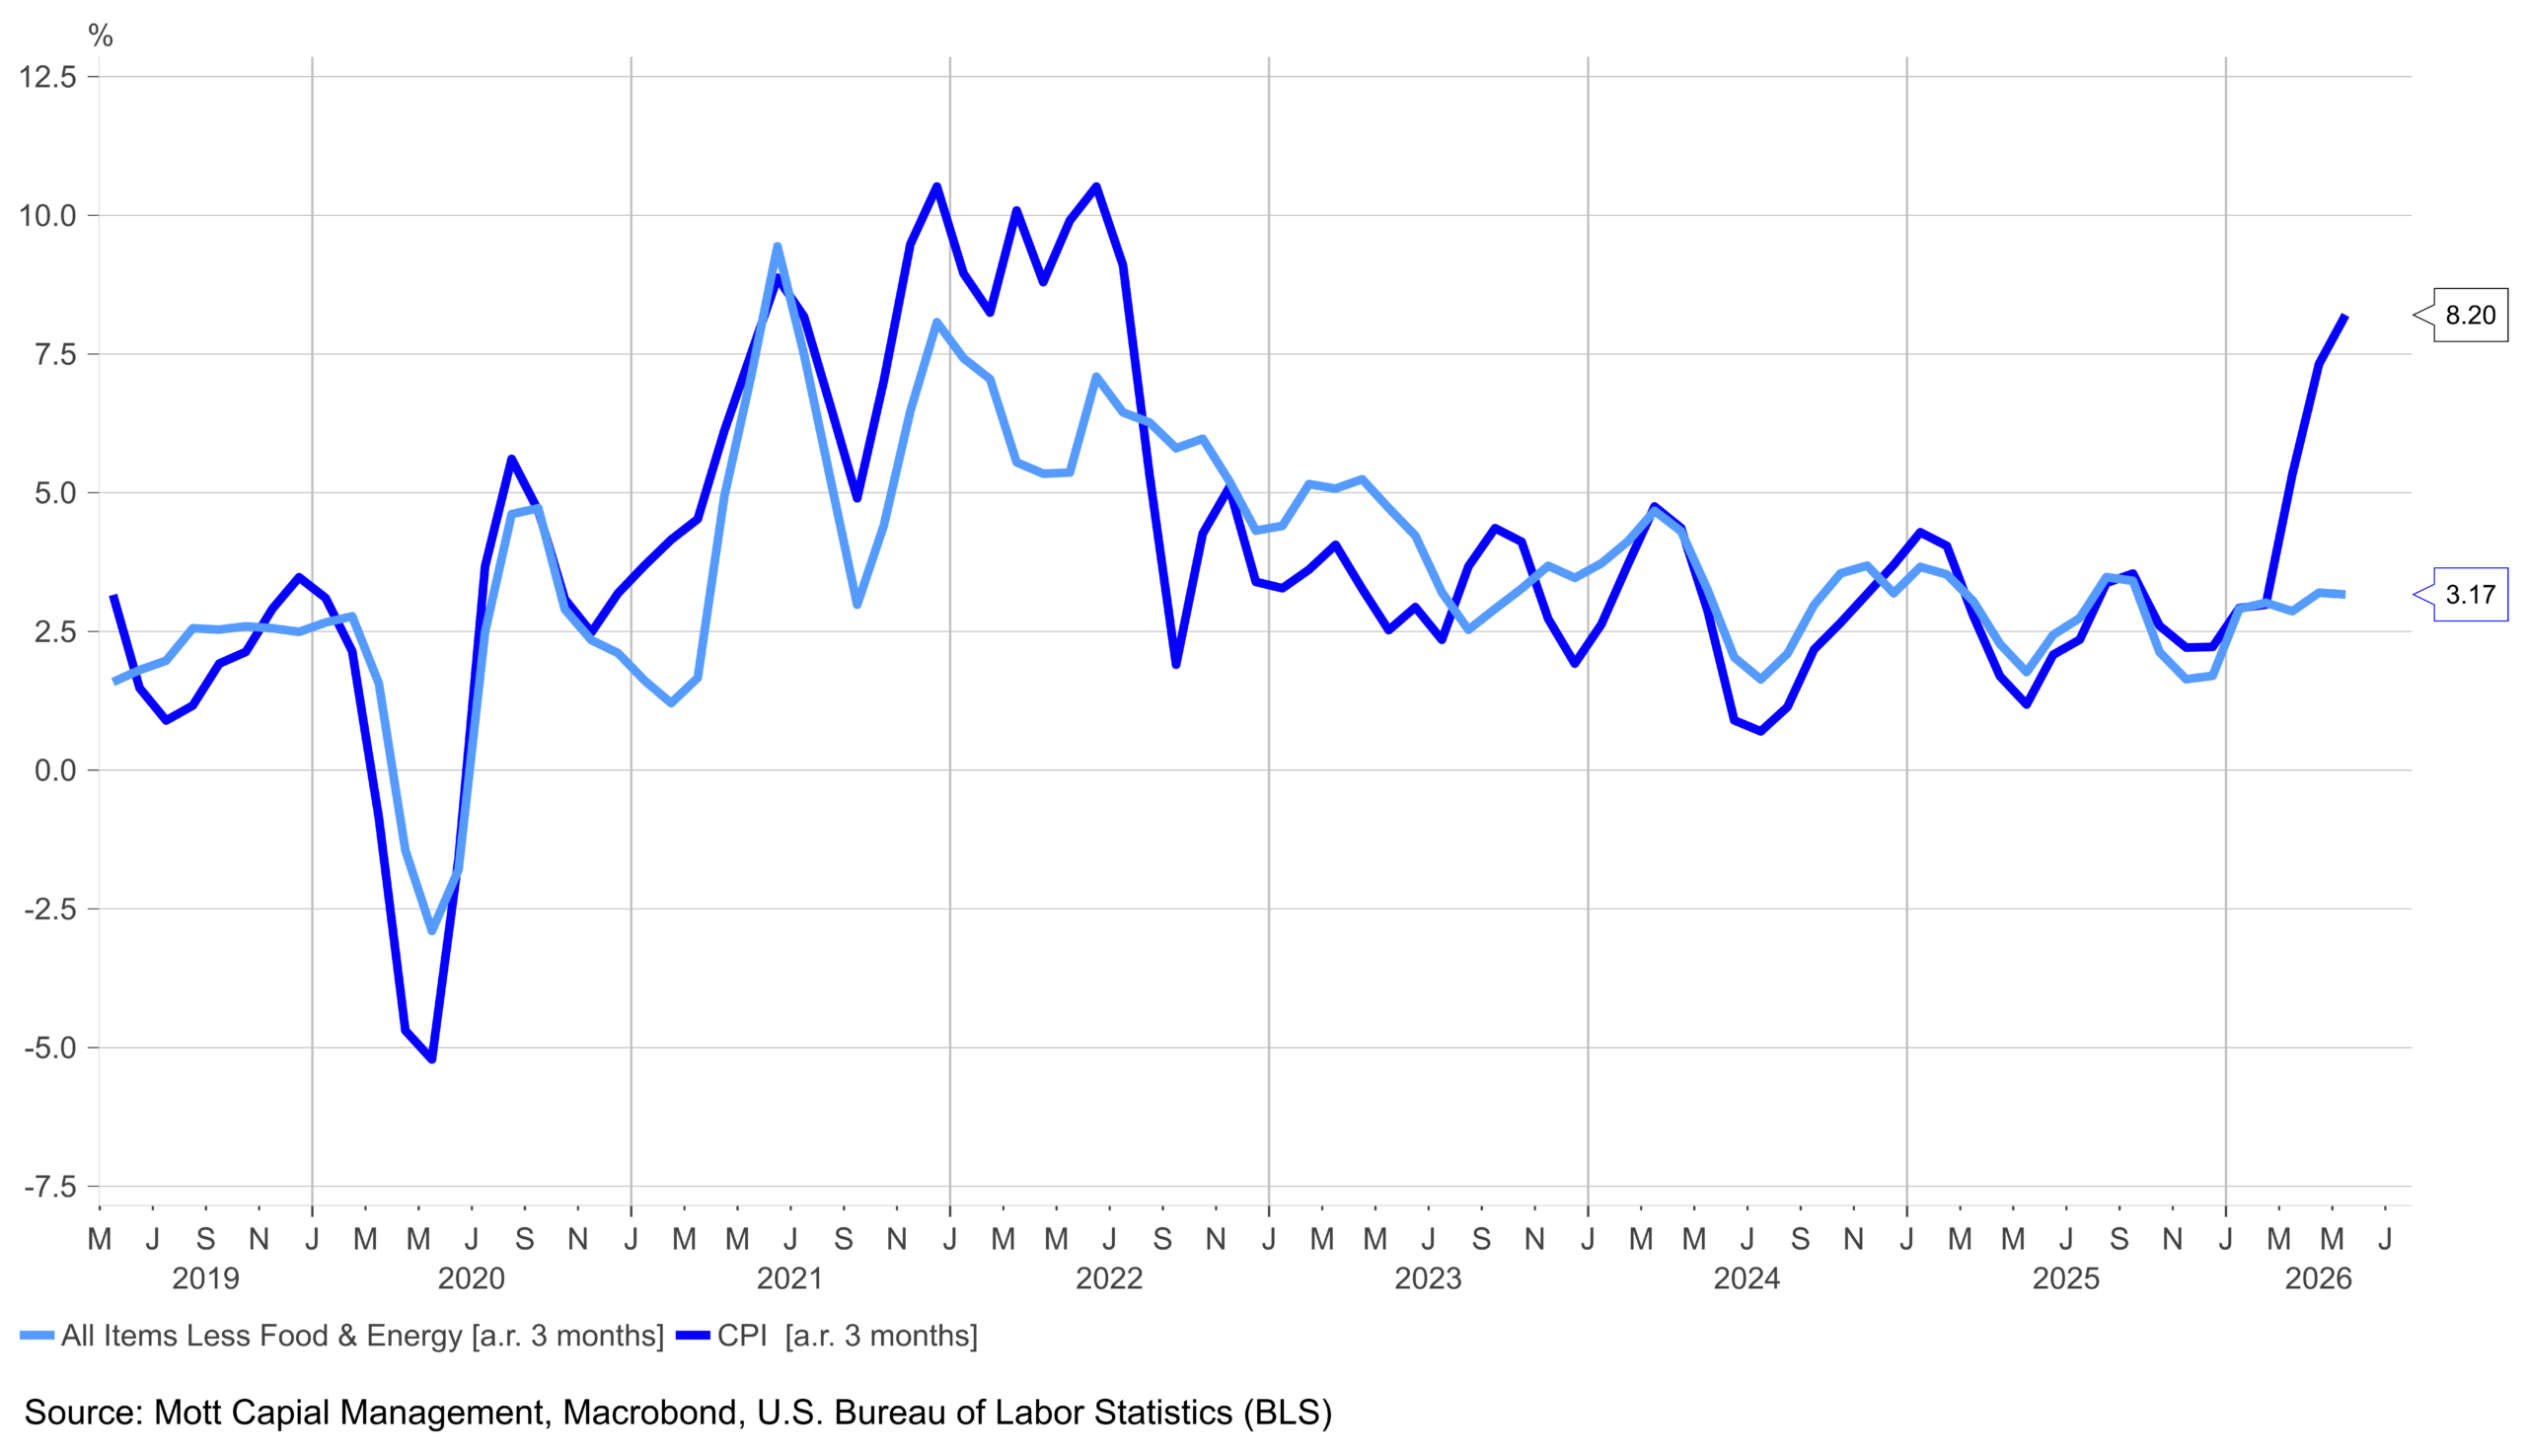
Core CPI excludes food and energy. This is the number the Federal Reserve watches most closely because it strips out temporary volatility. If headline CPI is hot but core CPI is cooling, the Fed may feel less pressure to hike rates aggressively.
For crypto, core CPI is the better predictor of medium-term liquidity. A decline in core inflation suggests the Fed's tightening cycle may be nearing its end, which is historically bullish for risk assets. Watch for core CPI to align with or beat the consensus; this is a strong signal of disinflation.

Finally, look under the hood. Check the sub-components for energy and food. If headline CPI is high solely because gasoline prices spiked 5% MoM, but core CPI is flat, the market should ignore the headline spike.
Energy prices are often driven by geopolitical events or seasonal demand, not monetary policy. If energy is the sole driver of a CPI miss, crypto markets may initially dip but recover quickly once traders realize the underlying inflation trend is stable. This distinction separates temporary noise from structural inflation.
By following this sequence, you avoid the trap of reacting to headline noise. The market moves on expectations, not just raw numbers. Confirm the trend with core data before adjusting your positions.
Read the surprise, not just the headline
The headline CPI number is often a lagging indicator, but the "surprise" component drives immediate crypto volatility. Traders don't react to the rate itself; they react to the deviation from the market's consensus forecast. If the Federal Reserve's dot plot suggests a hawkish stance, even a slight miss in inflation data can trigger a sharp correction in risk assets.
When interpreting this data for crypto positions, you must first identify the consensus estimate from major financial terminals. Compare the actual release against that number. A positive surprise (higher than expected) typically strengthens the dollar and pressures crypto prices lower, as higher yields make non-yielding assets less attractive. Conversely, a negative surprise can spark a relief rally.
| CPI vs. Forecast | DXY Reaction | BTC/ETH Action | Typical Trade |
|---|---|---|---|
| Higher than expected | Rises | Falls | Short or reduce leverage |
| Lower than expected | Falls | Rises | Long or add to spot |
| In line with forecast | Flat | Choppy | Wait for direction |
A common mistake is ignoring the Federal Reserve's reaction function. If inflation comes in hot, the market immediately prices in a higher-for-longer interest rate environment. This increases the opportunity cost of holding crypto. Always cross-reference the CPI release with the CME FedWatch Tool to see how the probability of a rate hike or cut shifts.
Avoid common CPI interpretation mistakes
Reading the headline Consumer Price Index number is the easiest part of the process; interpreting it correctly is where most traders lose money. The agency releases a headline figure, but treating that single percentage as a direct signal for Bitcoin or Ethereum is a rookie error. The market doesn't move on the headline alone—it moves on the deviation from expectations and the underlying trends that the headline masks.
Mistake 1: Ignoring Core Inflation
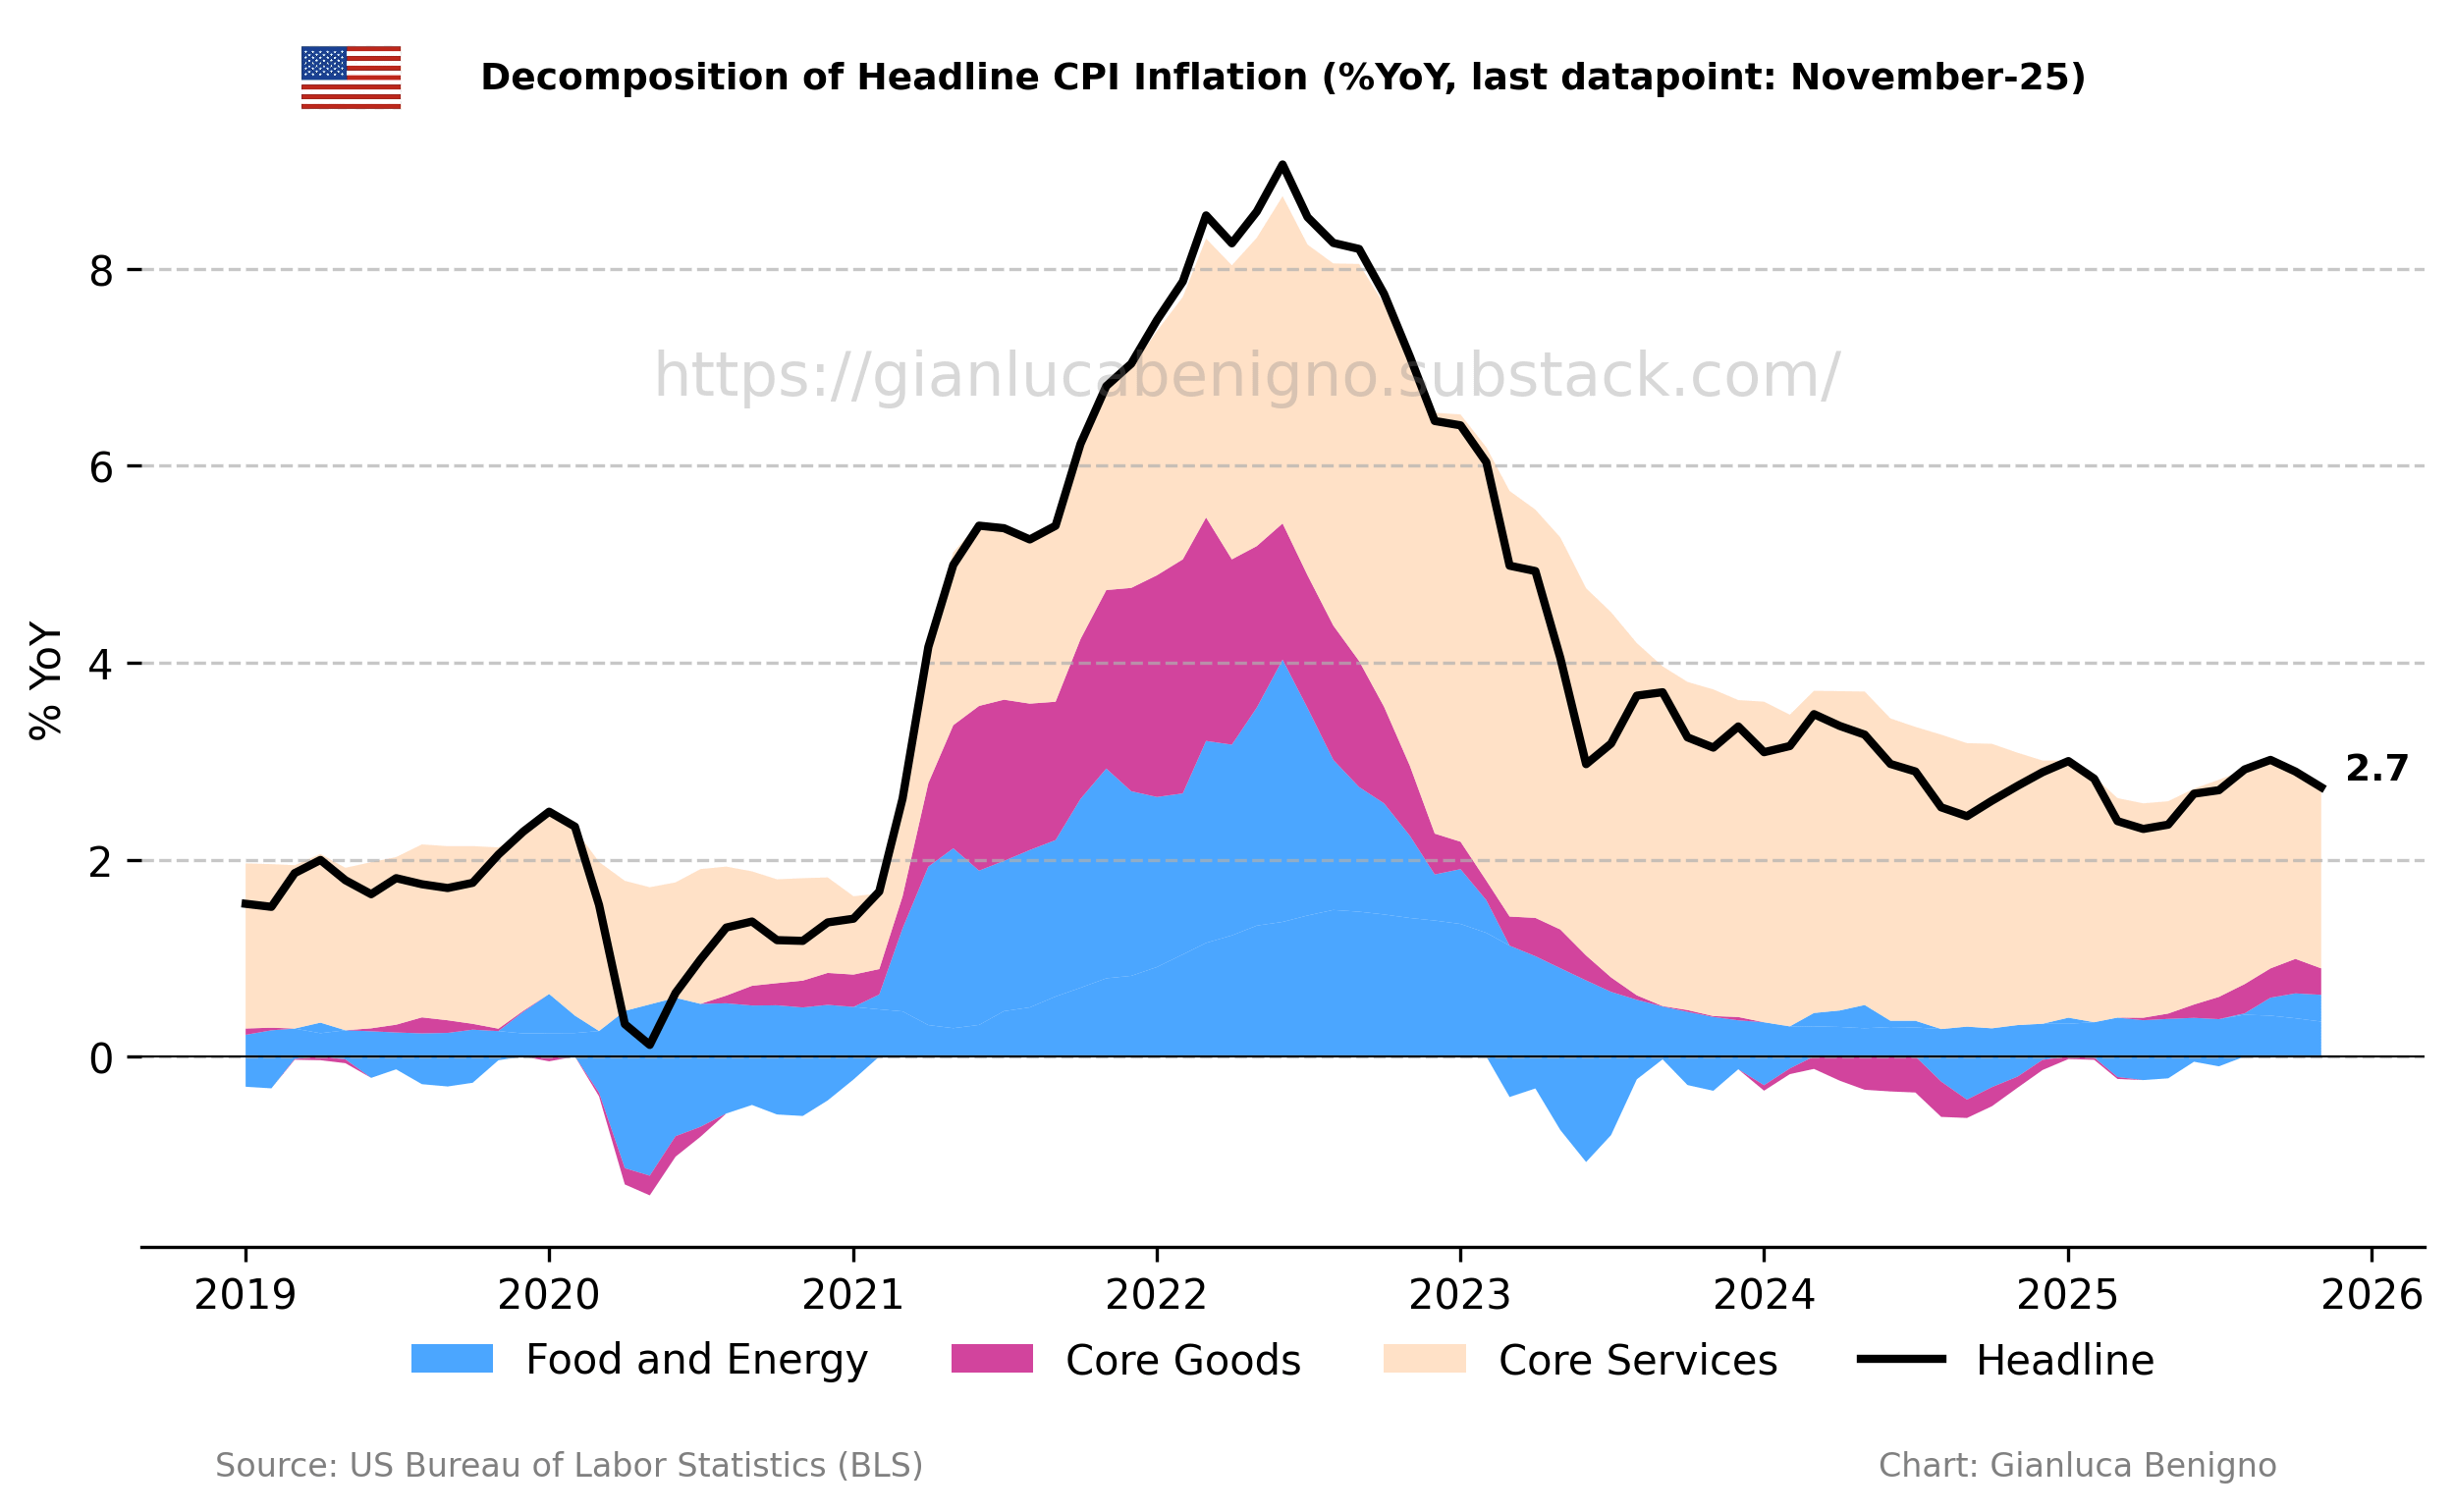
The headline CPI includes volatile food and energy prices, which can swing wildly due to geopolitical events or seasonal weather patterns. Core CPI, which excludes these two categories, provides a clearer picture of the Federal Reserve's actual policy target. When headline inflation spikes due to a temporary oil shock but core inflation remains stable, the Fed is unlikely to change interest rates aggressively. Crypto markets often overreact to the headline spike, selling off on fear, only to recover once the market realizes the underlying trend is benign.
Mistake 2: Overlooking Seasonal Adjustments
CPI data is seasonally adjusted to account for predictable patterns, such as holiday shopping surges or summer travel costs. If you compare a raw month-over-month figure without understanding these adjustments, you might misinterpret a normal seasonal uptick as a structural inflation problem. Always look at the year-over-year trend or the unadjusted data if you are trying to spot anomalies, but base your trading decisions on the seasonally adjusted core trend to avoid whipsaws.
Mistake 3: Treating All CPI Data as Equal
Not all CPI components affect crypto equally. Housing and services inflation have a stronger correlation with interest rate expectations than goods inflation. If the report shows rising shelter costs but falling electronics prices, the Fed may remain hawkish despite the "deflationary" goods sector. Focus on the services component, as it is stickier and more likely to keep the Federal Reserve constrained in its ability to cut rates, which is the primary driver for risk assets.
Check your pre-release strategy
The Consumer Price Index measures the change in the price of goods and services from the perspective of the consumer, acting as a primary driver for Federal Reserve policy decisions. Before the release, you need to ensure your portfolio is positioned to handle the volatility, not just react to it.
Review your position sizes and set stop-losses. Check the economic calendar on official sources like the BLS or FRED to confirm the exact release time. Having a plan prevents emotional trading during the initial price spike.
-
Review position sizes and reduce leverage
-
Set stop-losses to limit downside risk
-
Check the economic calendar for release time
-
Prepare a plan for both upside and downside scenarios
Frequently asked questions about CPI
Helpful gear
Use these product recommendations as a starting point, then choose the size, material, and price point that fit how you actually use the gear.


As an Amazon Associate, we may earn from qualifying purchases.
No comments yet. Be the first to share your thoughts!