
Why CPI matters for crypto portfolios
The Consumer Price Index (CPI) serves as the primary signal for how central banks manage liquidity, directly dictating crypto valuations. As defined by the Bureau of Labor Statistics (BLS), the CPI measures the average change over time in the prices paid by urban consumers for a representative basket of goods and services BLS. When inflation accelerates, the Federal Reserve typically tightens monetary policy, raising interest rates to cool demand. This tightening cycle drains risk appetite from speculative assets, including Bitcoin and Ethereum, as capital flows toward safer, yield-bearing instruments.
Understanding this mechanism is the core of a practical cpi guide for digital asset investors. The relationship is often inverse but not immediate. Markets frequently price in expected inflation months before the data is released. However, when actual CPI figures deviate significantly from consensus forecasts, the resulting volatility can be sharp. Investors who track these releases can anticipate shifts in the Federal Reserve's stance, allowing for better timing of entry and exit points in the crypto market.
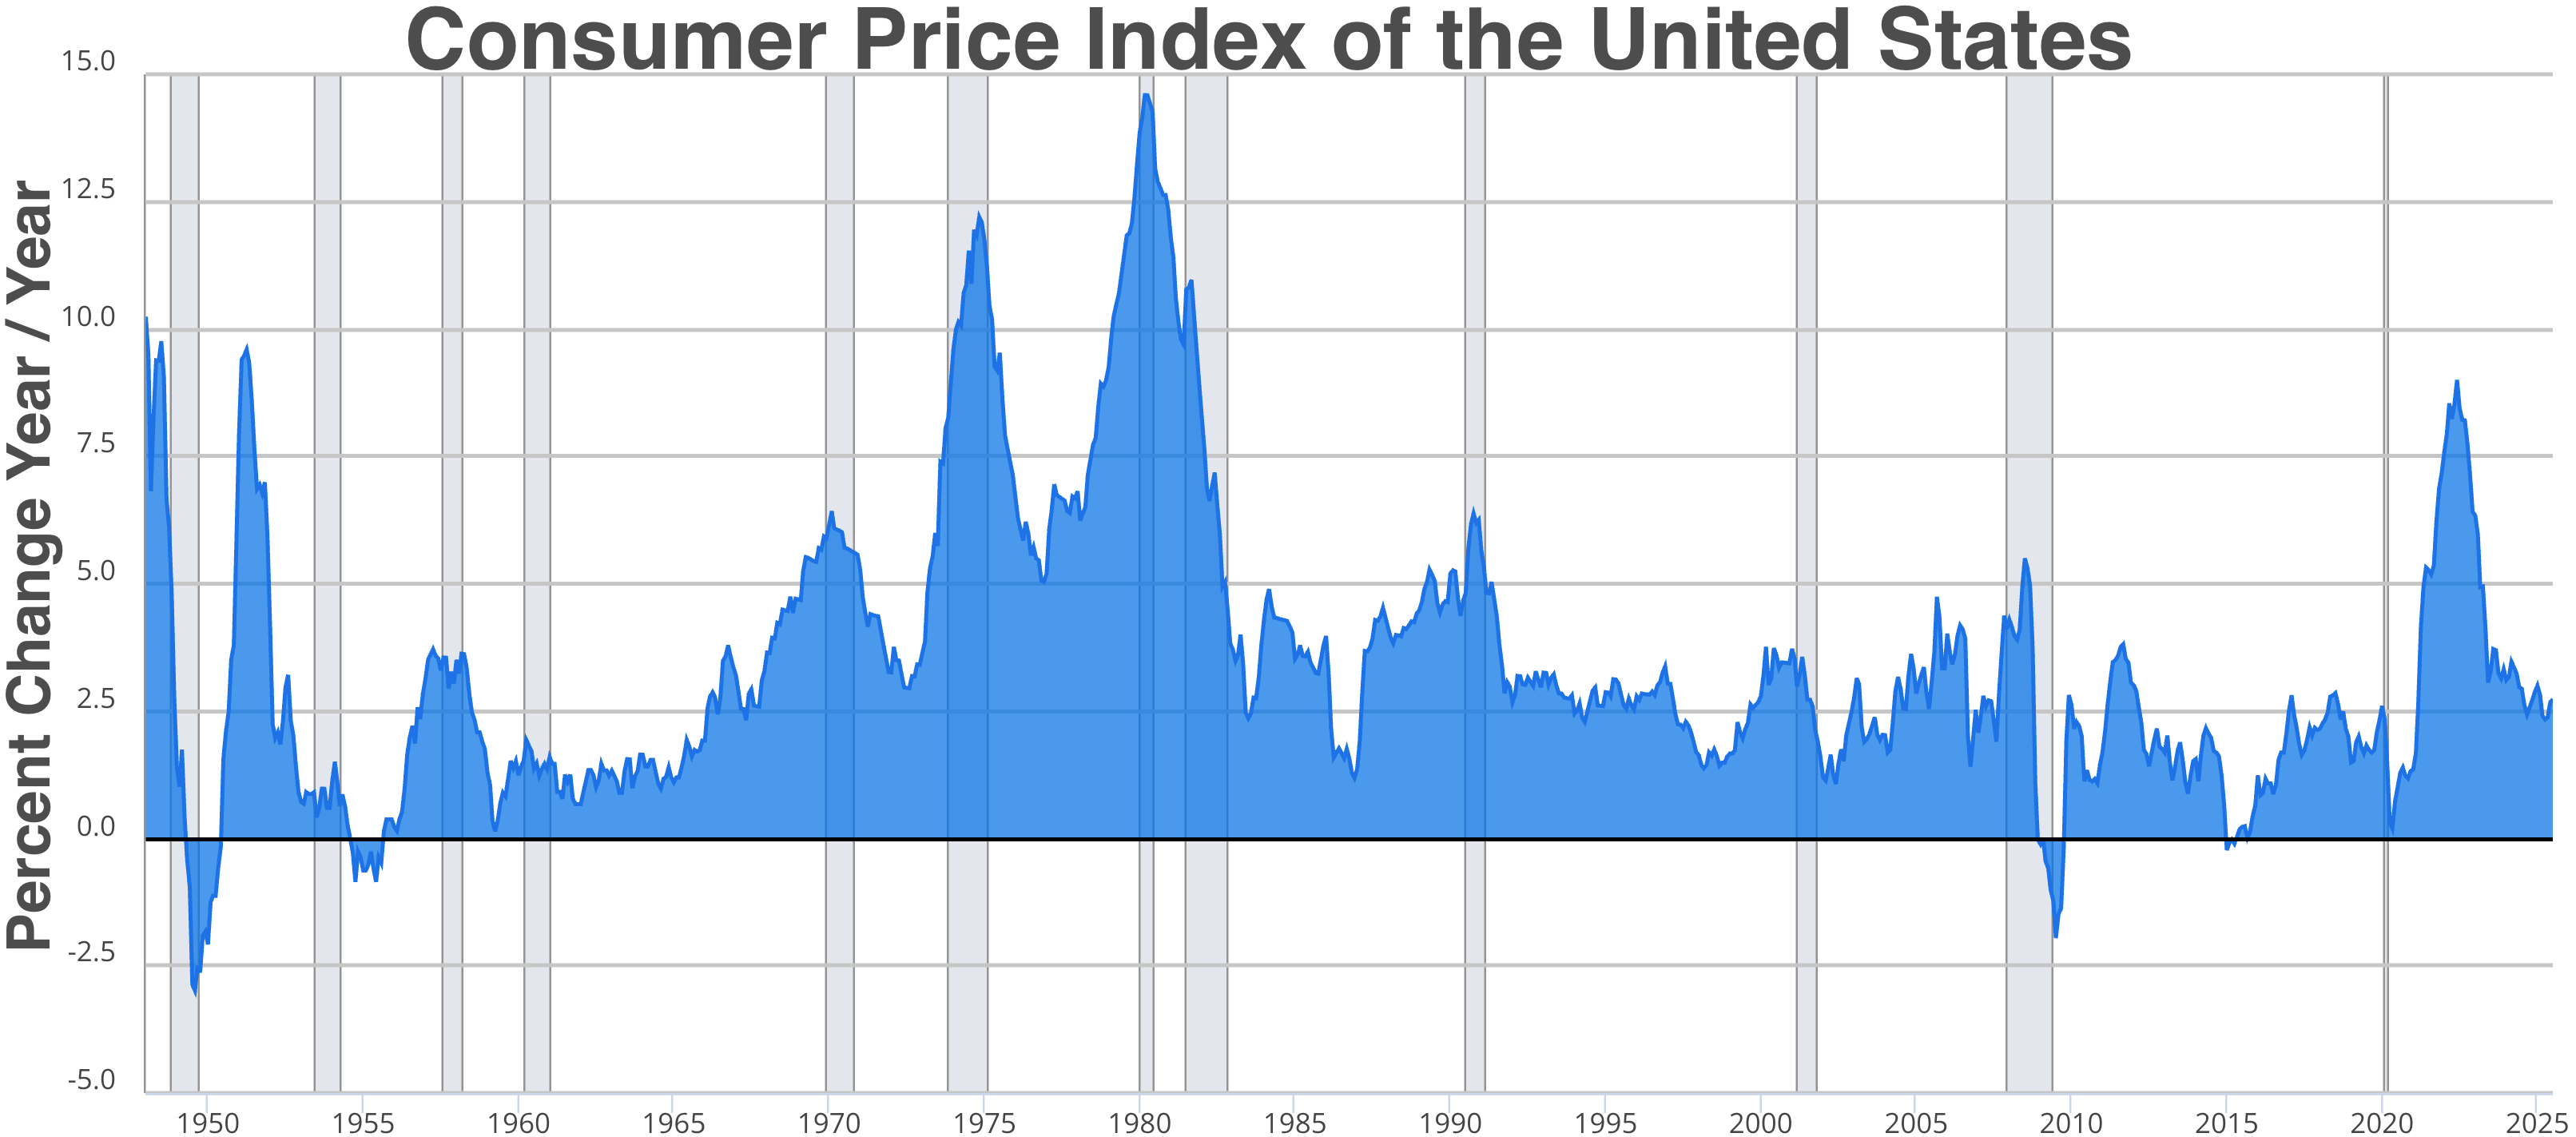
The data is publicly available through TreasuryDirect and the BLS, providing daily index ratios and historical schedules TreasuryDirect. By monitoring these official sources, you can separate market noise from structural trends. The chart below illustrates the historical correlation between CPI year-over-year changes and Bitcoin's price action, highlighting how macroeconomic pressure directly impacts digital asset performance.
Core CPI Infrastructure and Data Sources
Reliable inflation analysis begins with trustworthy data. The U.S. Bureau of Labor Statistics (BLS) publishes the official Consumer Price Index, tracking price changes for a representative basket of goods and services bought by urban consumers. For global context, the International Monetary Fund (IMF) provides standardized CPI methodologies and country-level data, ensuring comparability across markets.
Web3 infrastructure aggregates these traditional data points to enable on-chain analysis. Protocols integrate CPI feeds to adjust algorithmic stablecoins, trigger yield adjustments, or hedge against purchasing power erosion. This creates a bridge between macroeconomic indicators and decentralized finance, allowing smart contracts to react to real-world inflation trends.

Understanding these data sources is essential for any 2026 CPI guide. Whether you are monitoring BLS releases or IMF updates, the quality of your analysis depends on the integrity of the underlying data.
Real-Time CPI Analysis Tools
Tracking inflation data in real-time requires bridging the gap between traditional economic data and modern Web3 analytics. While the Bureau of Labor Statistics (BLS) provides the official baseline, the lag between release and market reaction creates a need for platforms that ingest and interpret this data instantly.
The most reliable real-time CPI infrastructure relies on direct feeds from official sources like TreasuryDirect, which publishes daily CPI data and TIPS index ratios. These feeds allow analysts to monitor inflation expectations as they happen, rather than waiting for monthly reports. For those integrating this data into automated strategies, APIs that pull from these official repositories offer the most accurate latency.
Comparing Data Platforms
Not all CPI tools are built equally. Some focus on raw data ingestion, while others provide predictive modeling based on historical trends. The following comparison highlights the key differences between leading platforms used for real-time inflation tracking.
| Platform | Data Source | Latency | Integration Ease |
|---|---|---|---|
| TreasuryDirect Feed | BLS Official | Daily | API/Manual |
| Bloomberg Terminal | BLS + Estimates | Real-Time | Proprietary |
| Chainlink CPI Feeds | Aggregated BLS | Block-Based | Smart Contracts |
| FRED API | BLS Official | Daily | Developer Friendly |
Visualizing the Data
Understanding CPI trends often requires visualizing the data against other economic indicators. The following image illustrates a common approach to mapping CPI data against broader market metrics, helping analysts identify correlations that raw numbers might miss.
Technical Charting for CPI
For traders and analysts, integrating CPI data into technical charts is essential for spotting inflection points. The following chart demonstrates how CPI-related assets can be analyzed using standard technical indicators, providing a visual context for inflation-driven market movements.
Build a CPI-Based Investment Strategy
Incorporating inflation data into your crypto portfolio requires a shift from pure speculation to tactical positioning. Inflation data acts as a real-time signal for macroeconomic liquidity, directly influencing risk appetite across digital assets. By aligning your holdings with CPI trends, you can mitigate downside risk during high-inflation periods and capture upside when price stability returns.
Monitor Official CPI Releases
The first step is establishing a reliable data feed from official sources like the Bureau of Labor Statistics (BLS). Avoid relying on delayed or third-party interpretations. The BLS publishes the CPI on a fixed schedule, providing a consistent baseline for market analysis. Track the headline CPI and core CPI (excluding food and energy) to distinguish between temporary supply shocks and persistent inflationary pressure.
Hedge Against High Inflation
When CPI data shows sustained increases, traditional crypto assets like Bitcoin often face headwinds as investors flee risk. In these environments, consider shifting a portion of your portfolio into stablecoins or inflation-protected assets. Stablecoins offer yield opportunities without the volatility of speculative tokens, preserving capital when broader markets contract. Treasury Inflation-Protected Securities (TIPS) data, available via TreasuryDirect, can also serve as a benchmark for real returns in the traditional market.
Seek Yield in Stable Assets
During periods of low or deflationary CPI, risk appetite typically returns. This is the time to increase exposure to high-growth altcoins and decentralized finance (DeFi) protocols. Look for yield-generating opportunities in stablecoin lending platforms, which often see increased demand when inflation is low. However, always assess the protocol's security and regulatory compliance before deploying capital.
Rebalance Based on CPI Trends
Regularly review your portfolio allocation in response to CPI releases. A simple rule of thumb is to reduce risk exposure when CPI exceeds target levels (e.g., above 3-4%) and increase it when CPI stabilizes. Use technical charts to time these rebalancing actions, ensuring you enter and exit positions at optimal levels rather than reacting emotionally to news headlines.
Subscribe to Bureau of Labor Statistics notifications for monthly CPI releases. This ensures you receive data the moment it becomes public, allowing for immediate market analysis.

Compare core CPI (excluding volatile food and energy prices) with headline CPI. Divergences between the two can signal underlying inflationary trends that headlines might miss.

Increase stablecoin holdings when CPI rises above target levels. Use DeFi platforms to earn yield on these stable assets, protecting purchasing power against inflation.
Reduce exposure to high-volatility altcoins during high-inflation periods. Reallocate to Bitcoin or Ethereum, which may offer better store-of-value characteristics during economic uncertainty.
Recommended resources for CPI research
Building a robust understanding of the Consumer Price Index requires moving beyond headline numbers to the underlying methodology. The following resources provide the technical depth needed for serious infrastructure and analysis work.
Essential Reading
For a foundational grasp of how CPI is compiled, the Consumer Price Index Manual: Concepts and Methods (2020) is the definitive text. Published by the IMF and ILO, this manual details the conceptual frameworks and statistical methods used globally. It is an essential reference for anyone looking to understand the mechanics behind the data rather than just the output.
Practical Tools and Guides
To apply this knowledge in market analysis, practical guides on trading inflation data are valuable. Look for comprehensive cpi guide materials that explain how to interpret BLS releases and anticipate market volatility. These resources often bridge the gap between theoretical index construction and real-world financial strategy.


As an Amazon Associate, we may earn from qualifying purchases.
No comments yet. Be the first to share your thoughts!