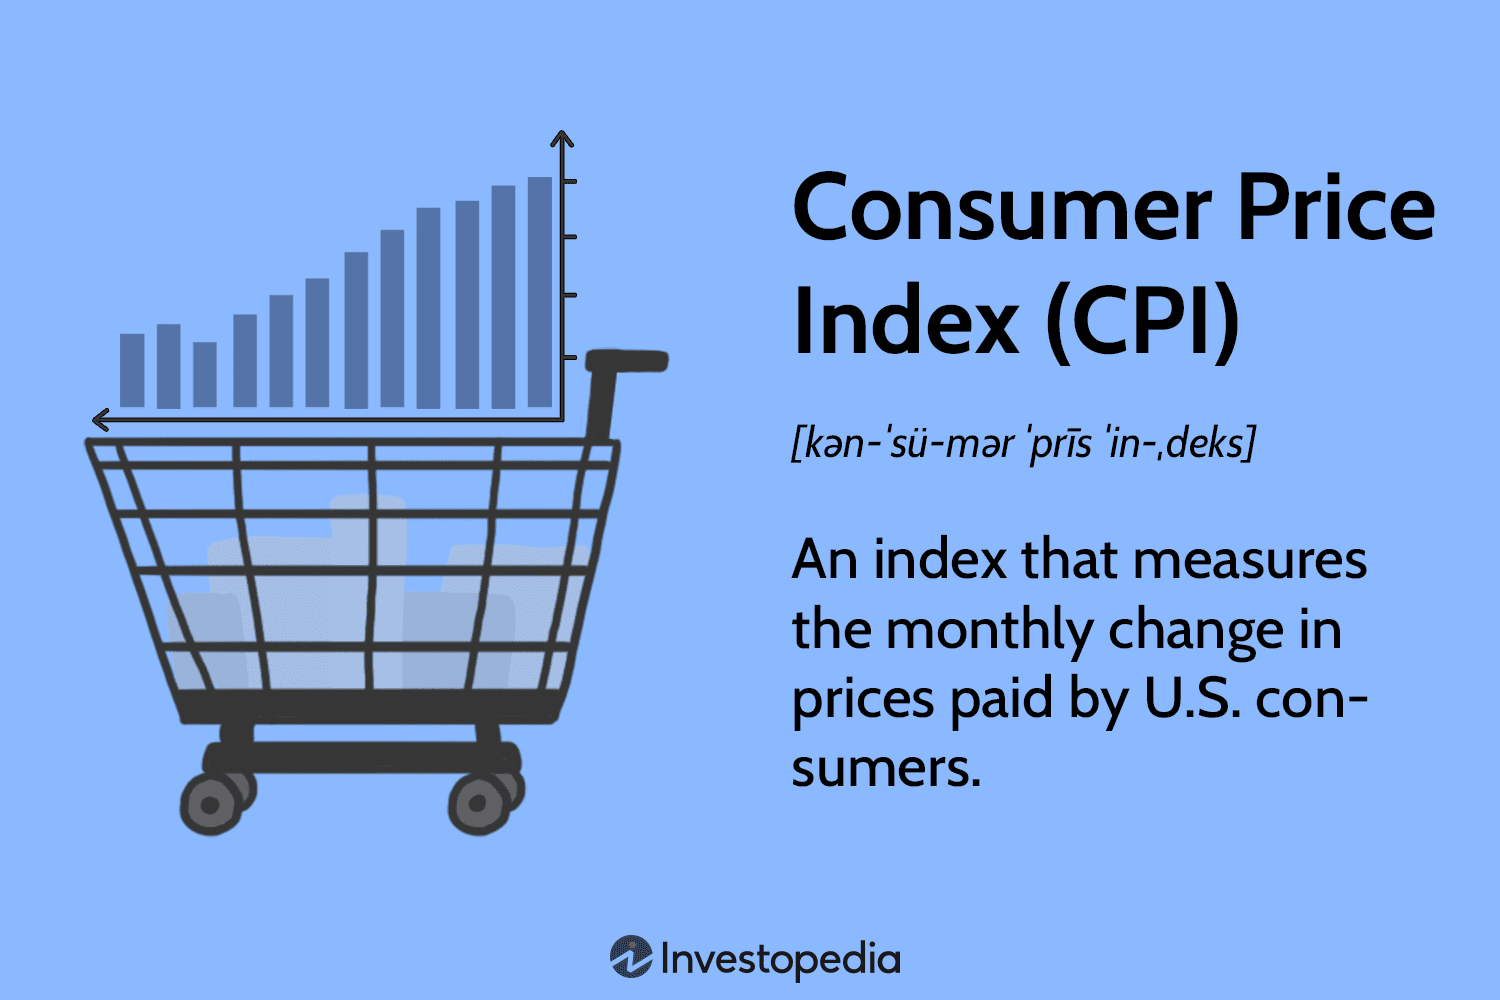
What the CPI Actually Measures
The Consumer Price Index (CPI) is often misunderstood as a tracker of investment assets or broad economic health. In reality, it measures the cost of a specific basket of goods and services that urban consumers buy. This distinction is critical because it means CPI reflects the price changes of everyday items—like groceries, rent, and fuel—rather than the performance of the stock market or real estate values.
The Bureau of Labor Statistics (BLS) calculates this index by tracking price changes for thousands of items across various categories. Each category is weighted based on how much the average consumer spends on it. For example, housing typically carries a larger weight than apparel because it represents a bigger portion of household budgets. This weighting ensures the index mirrors actual consumer spending habits rather than theoretical economic models.
The International Labour Organization (ILO) provides the conceptual framework for compiling these indices, ensuring consistency across different countries. Their manual outlines how to select representative items and adjust for quality changes, which prevents price increases from being misinterpreted as inflation when they are actually due to better products. Understanding this mechanical foundation helps clarify why CPI is the primary tool for adjusting income eligibility levels and federal tax brackets.
By focusing on the consumer basket, CPI serves as a direct gauge of purchasing power. When the index rises, it means consumers need more money to buy the same goods. This is distinct from asset inflation, which might see home values or stocks rise without necessarily impacting the cost of daily necessities. Keeping this separation clear is essential for accurate economic analysis.
Where to Find Official CPI Data
CPI works best as a clear sequence: define the constraint, compare the realistic options, test the tradeoff, and choose the path with the fewest hidden costs. That order keeps the advice usable instead of decorative. After each step, pause long enough to check whether the recommendation still fits the reader's actual situation. If it depends on perfect timing, unusual access, or a best-case budget, include a simpler fallback.
The simplest way to use this section is to write down the real constraint first, compare each option against it, and choose the path that still works outside ideal conditions.
Visualize CPI trends with technical charts
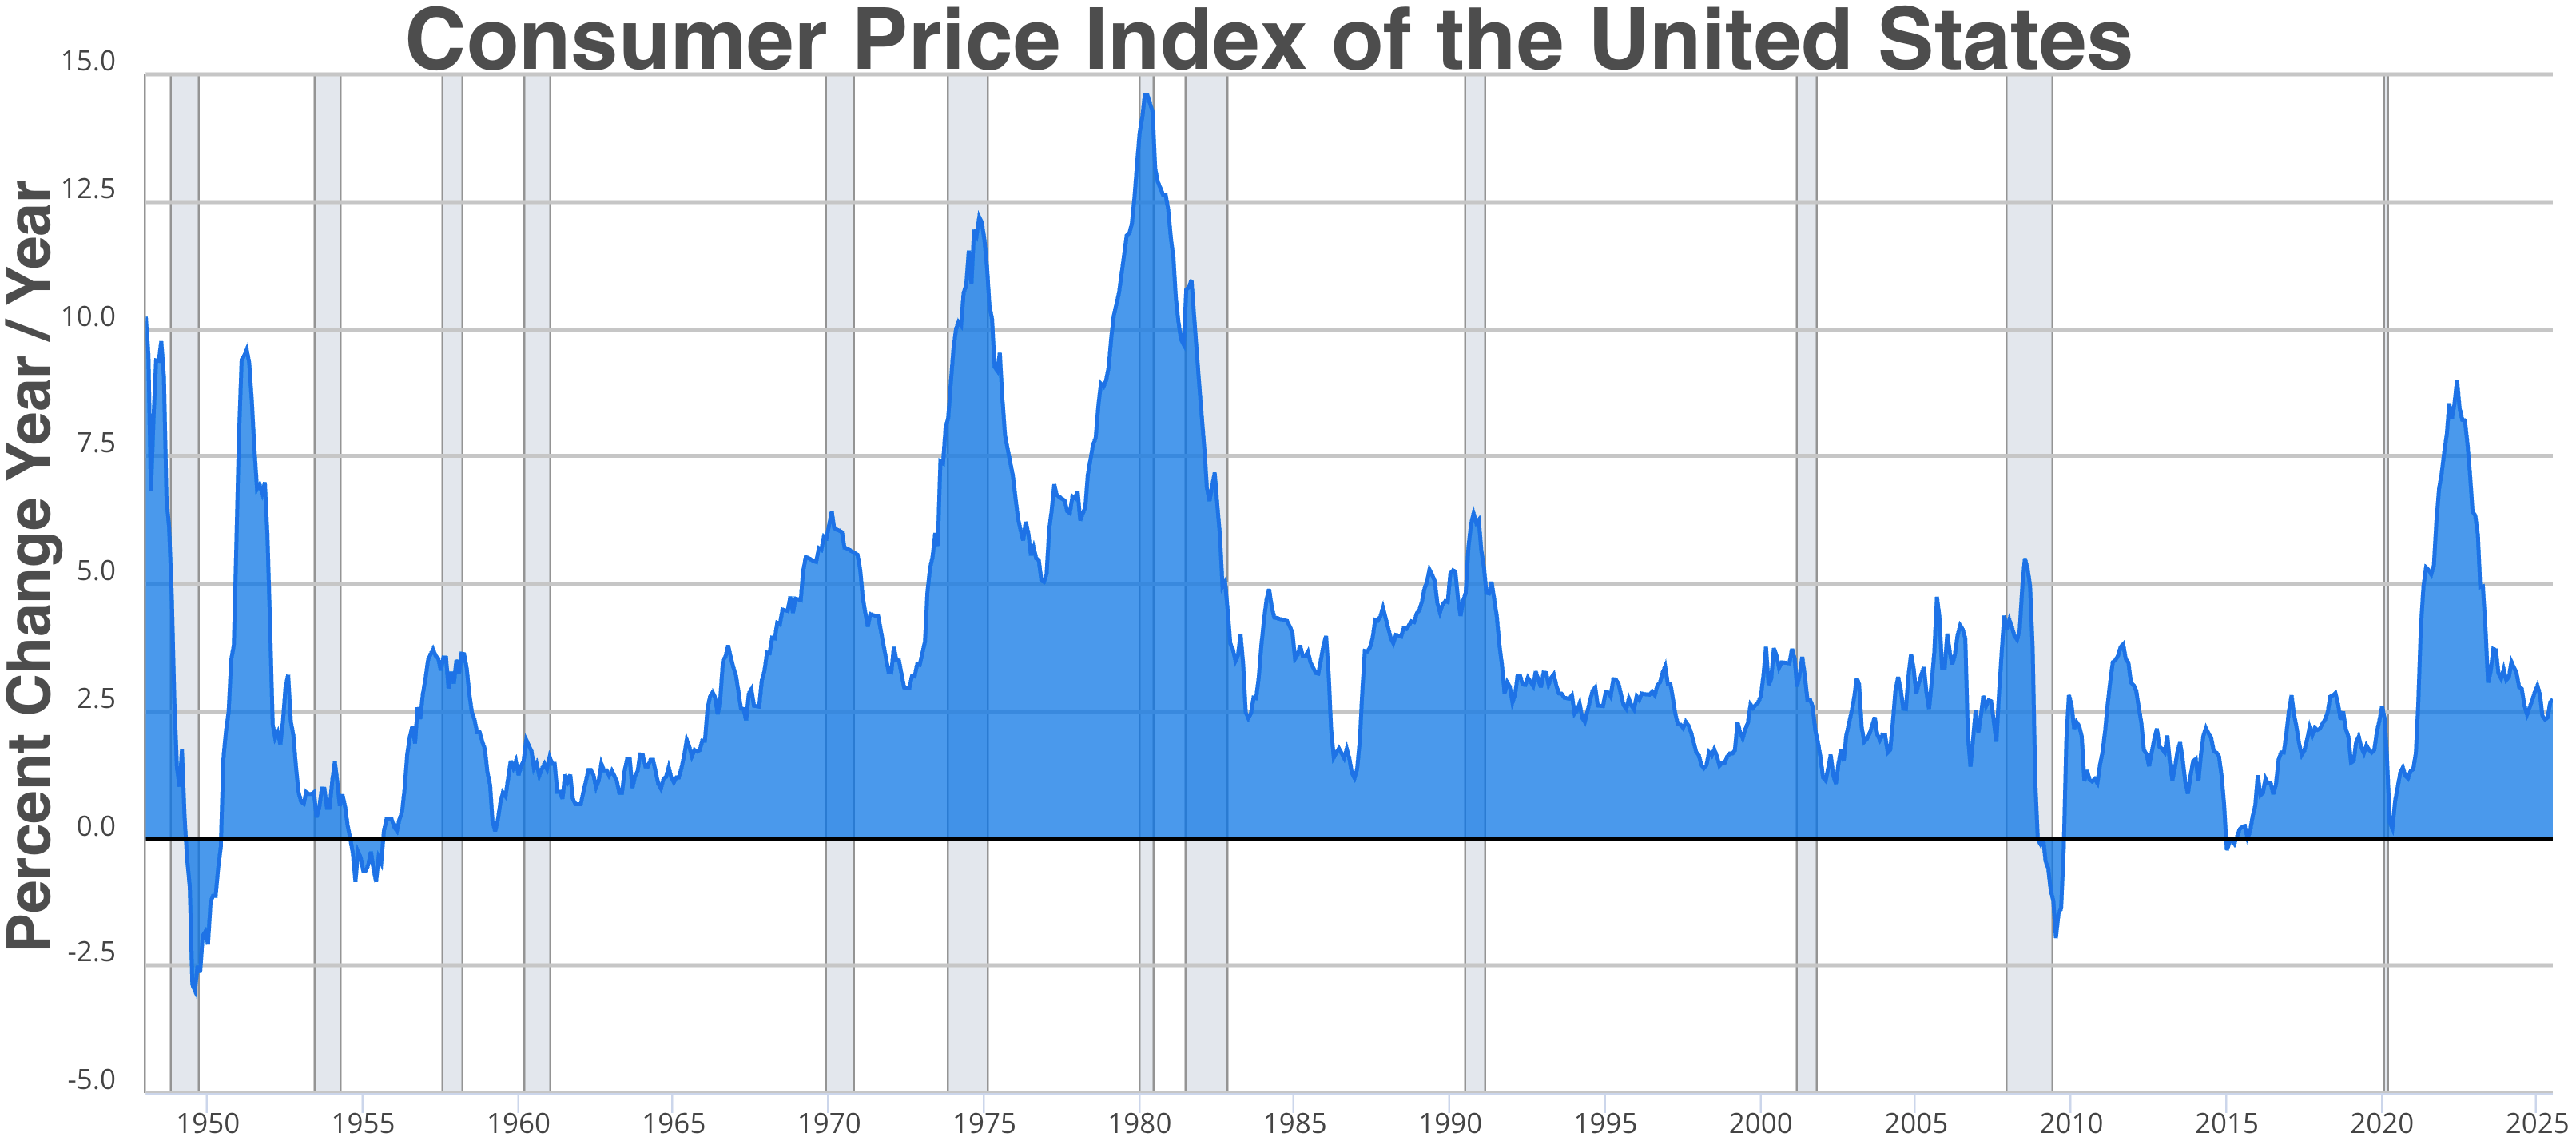
Static tables of monthly inflation rates are hard to read. A technical chart turns those numbers into a clear picture of where prices are heading. By plotting the Consumer Price Index over time, you can spot the difference between temporary price spikes and long-term inflationary pressure.
The chart below shows the long-term trajectory of the US Consumer Price Index. You can see the baseline stability before the 2020s, followed by the sharp volatility that marked the recent inflation cycle. This visual context helps you understand the magnitude of price changes better than a single percentage point.

Start with the headline CPI or the core CPI (which excludes food and energy). Core CPI is often preferred by economists because it filters out volatile items, giving a clearer signal of underlying inflation trends.
Most charting tools allow you to add moving averages. A 12-month moving average smooths out monthly noise, helping you see the true direction of prices. If the line is flat, inflation is stable. If it’s rising, prices are accelerating.

Inflation doesn’t exist in a vacuum. Overlaying the Federal Reserve’s target rate on your chart helps you see the "real" interest rate. When inflation is higher than the nominal rate, borrowing costs are effectively negative, which can stimulate spending.
The chart above visualizes these trends using provider-backed data. It updates in real-time, ensuring you are always looking at the most current economic signals rather than stale historical snapshots.
Tools for CPI Market Research
Tracking inflation isn't just about reading a headline number; it's about processing raw data from the Bureau of Labor Statistics (BLS) and international bodies like the IMF. The right software turns chaotic price indices into clear trends, helping you spot whether the Fed is tightening or loosening policy.
Start with the data itself. The BLS provides the Consumer Price Index through their official data portal, but raw CSV files are hard to visualize. Analysts typically use Excel for quick pivots or Python/R for deeper statistical modeling. For those who prefer visual dashboards, tools like Tableau or Power BI connect directly to BLS APIs, allowing you to track core inflation rates in real time without manual updates.
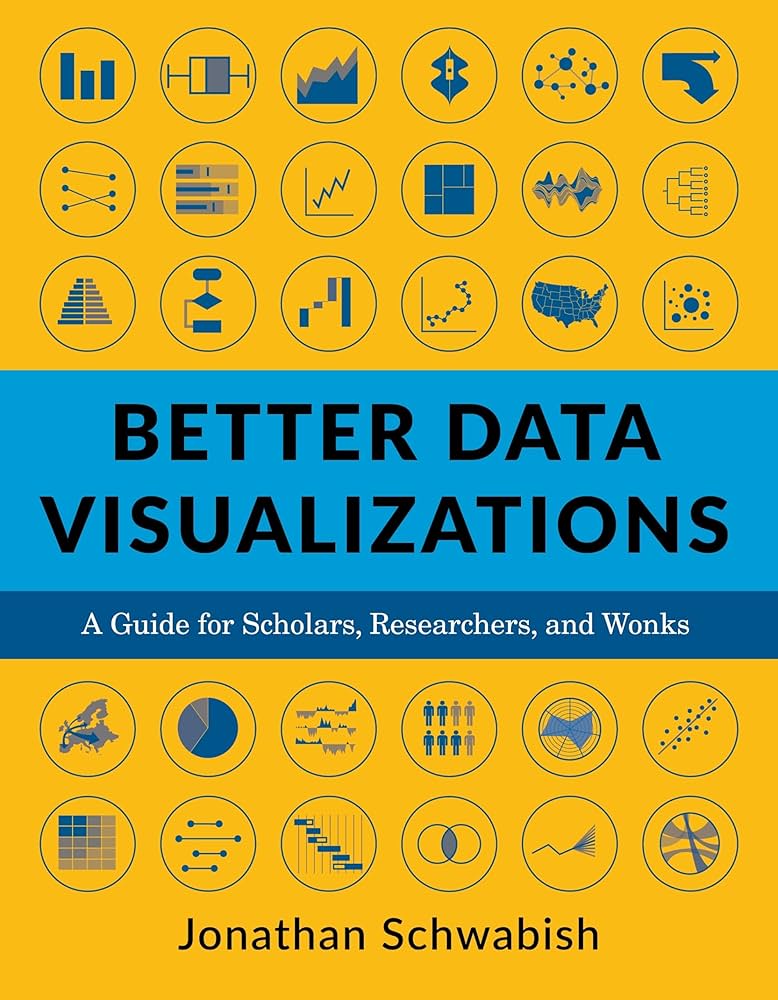
If you are building models from scratch, having a solid reference guide is essential. The following books and tools are widely used by economists and data analysts to understand CPI mechanics and implement tracking systems.


As an Amazon Associate, we may earn from qualifying purchases.
For market context, it helps to see how CPI data correlates with broader economic indicators. While CPI measures consumer prices, it often moves in tandem with broader market expectations. You can monitor these movements using live market data widgets below, which reflect how investors are pricing in inflation expectations.
Adjusting for Cost of Living
CPI data isn't just a headline number; it's a practical tool for protecting your purchasing power. The Bureau of Labor Statistics uses CPI indexes to adjust federal tax brackets and income eligibility levels for government assistance, ensuring these values keep pace with actual inflation [src-serp-3]. For individual investors, this means your nominal returns might look healthy while your real buying power shrinks if inflation outpaces your gains.
To apply this to your strategy, start by comparing your portfolio's nominal return against the current CPI-U (Consumer Price Index for All Urban Consumers). If your return is lower than the CPI increase, you are effectively losing wealth. This simple check helps you decide whether to shift from fixed-income assets to inflation-resistant equities or real assets.
Analyzing TIPS and Inflation Hedges
Treasury Inflation-Protected Securities (TIPS) are designed specifically to address this risk. The principal value of TIPS adjusts based on changes in the CPI, providing a direct hedge against rising prices [src-serp-6]. When CPI rises, the principal increases, leading to higher interest payments. Conversely, if deflation occurs, the principal adjusts downward, though investors are guaranteed the full face value at maturity.
When evaluating TIPS, look at the real yield rather than the nominal coupon. A positive real yield indicates that the bond is expected to outpace inflation. However, TIPS are not risk-free; they are sensitive to interest rate changes. Use the chart below to monitor broader market trends that often move in tandem with inflation expectations.
Rebalancing Your Portfolio
Use CPI releases as a regular checkpoint for rebalancing. If inflation remains sticky above your target, consider increasing exposure to assets with pricing power, such as consumer staples or energy stocks. Conversely, if CPI cools toward the Federal Reserve's 2% target, you might reduce defensive holdings and increase exposure to growth sectors.
Checklist for CPI-driven rebalancing:
- Compare nominal returns to CPI-U growth
- Review real yields on TIPS and inflation-linked bonds
- Assess sector exposure to inflation-resistant industries
- Adjust asset allocation based on real return gaps
No comments yet. Be the first to share your thoughts!