Defining the Research Scope
When you see "CPI" in a market analysis, your first instinct might be to check inflation rates or consumer spending trends. That is a natural reaction, but it is also the wrong one for this guide. In the context of infrastructure project management, CPI stands for Cost Performance Index. It is not a macroeconomic indicator of price levels; it is a precise efficiency metric used to track how well a project is using its budget.
This ambiguity is common. The same acronym serves two very different masters: economists and project managers. Economists use CPI to measure the average change over time in the prices paid by urban consumers for a market basket of consumer goods and services. Project managers, however, use it to answer a single, critical question: Are we getting value for every dollar spent?
For infrastructure developers, engineers, and investors, the Cost Performance Index is a vital diagnostic tool. It measures cost efficiency by comparing the budgeted cost of work performed (earned value) against the actual cost of that work. A CPI of 1.0 means the project is on budget. Below 1.0 indicates overspending; above 1.0 suggests under-spending, which can sometimes signal scope cuts or quality issues. By anchoring our research here, we can provide actionable insights for managing complex infrastructure budgets, rather than discussing broad economic trends that have little bearing on individual project execution.
Tracking real-time project data
To make CPI tracking effective in real life, start with the reader's actual constraint: data integrity. Separate must-have requirements from details that are merely nice to have. A practical choice should survive normal use, maintenance, timing, and budget. If a recommendation only works in an ideal situation, call that out plainly and give the reader a fallback path.
The simplest way to use this section is to write down the must-have criteria first, then compare each option against those criteria before weighing nice-to-have features.
Comparing analysis platforms
Choosing the right software for Cost Performance Index (CPI) tracking requires looking beyond basic budgeting features. Infrastructure projects involve complex resource allocation and long-term schedule dependencies, meaning your tool must handle Earned Value Management (EVM) data with precision. A mismatched platform can obscure early warning signs of cost overruns, turning manageable variances into major financial liabilities.
When evaluating platforms, focus on three core capabilities: data accuracy, CPI calculation automation, and reporting granularity. Manual entry introduces error; automated integration with procurement and time-tracking systems ensures your CPI reflects reality. Below is a comparison of leading tools used in infrastructure project management.
| Platform | Data Accuracy | CPI Automation | Reporting Depth |
|---|---|---|---|
| Oracle Aconex | High (Enterprise-grade integration) | Full EVM engine | Advanced dashboards & audit trails |
| Procore | High (Cloud-native sync) | Built-in EVM modules | Visual dashboards & mobile access |
| Primavera P6 | Very High (Industry standard) | Complex EVM calculations | Detailed variance analysis |
| Microsoft Project | Medium (Manual integration) | Basic CPI formulas | Standard Gantt & tables |
Oracle Aconex and Primavera P6 dominate large-scale infrastructure due to their robust EVM engines, though they carry a steeper learning curve. Procore offers a more user-friendly interface with strong cloud integration, making it suitable for teams prioritizing accessibility. Microsoft Project remains a viable option for smaller projects but often requires supplemental tools for advanced CPI automation. Select based on your team’s technical capacity and the scale of your infrastructure portfolio.
Essential hardware and accessories
Field data collection is the backbone of accurate Cost Performance Index (CPI) tracking. When your team is out on the road assessing road repairs or bridge maintenance, the tools they carry determine whether your cost efficiency metrics are precise or guesswork. Ruggedized hardware ensures that site conditions—dust, rain, or vibration—don't corrupt the data you need to calculate earned value against actual costs.
Rugged tablets for site reporting
Standard consumer tablets crack under the weight of a construction site. You need devices built to military standards (MIL-STD-810G) that can survive drops and still display clearly in direct sunlight. These tablets run your project management software, allowing inspectors to log material usage and labor hours in real time. This immediacy prevents the "end-of-week" data gaps that often skew CPI calculations.
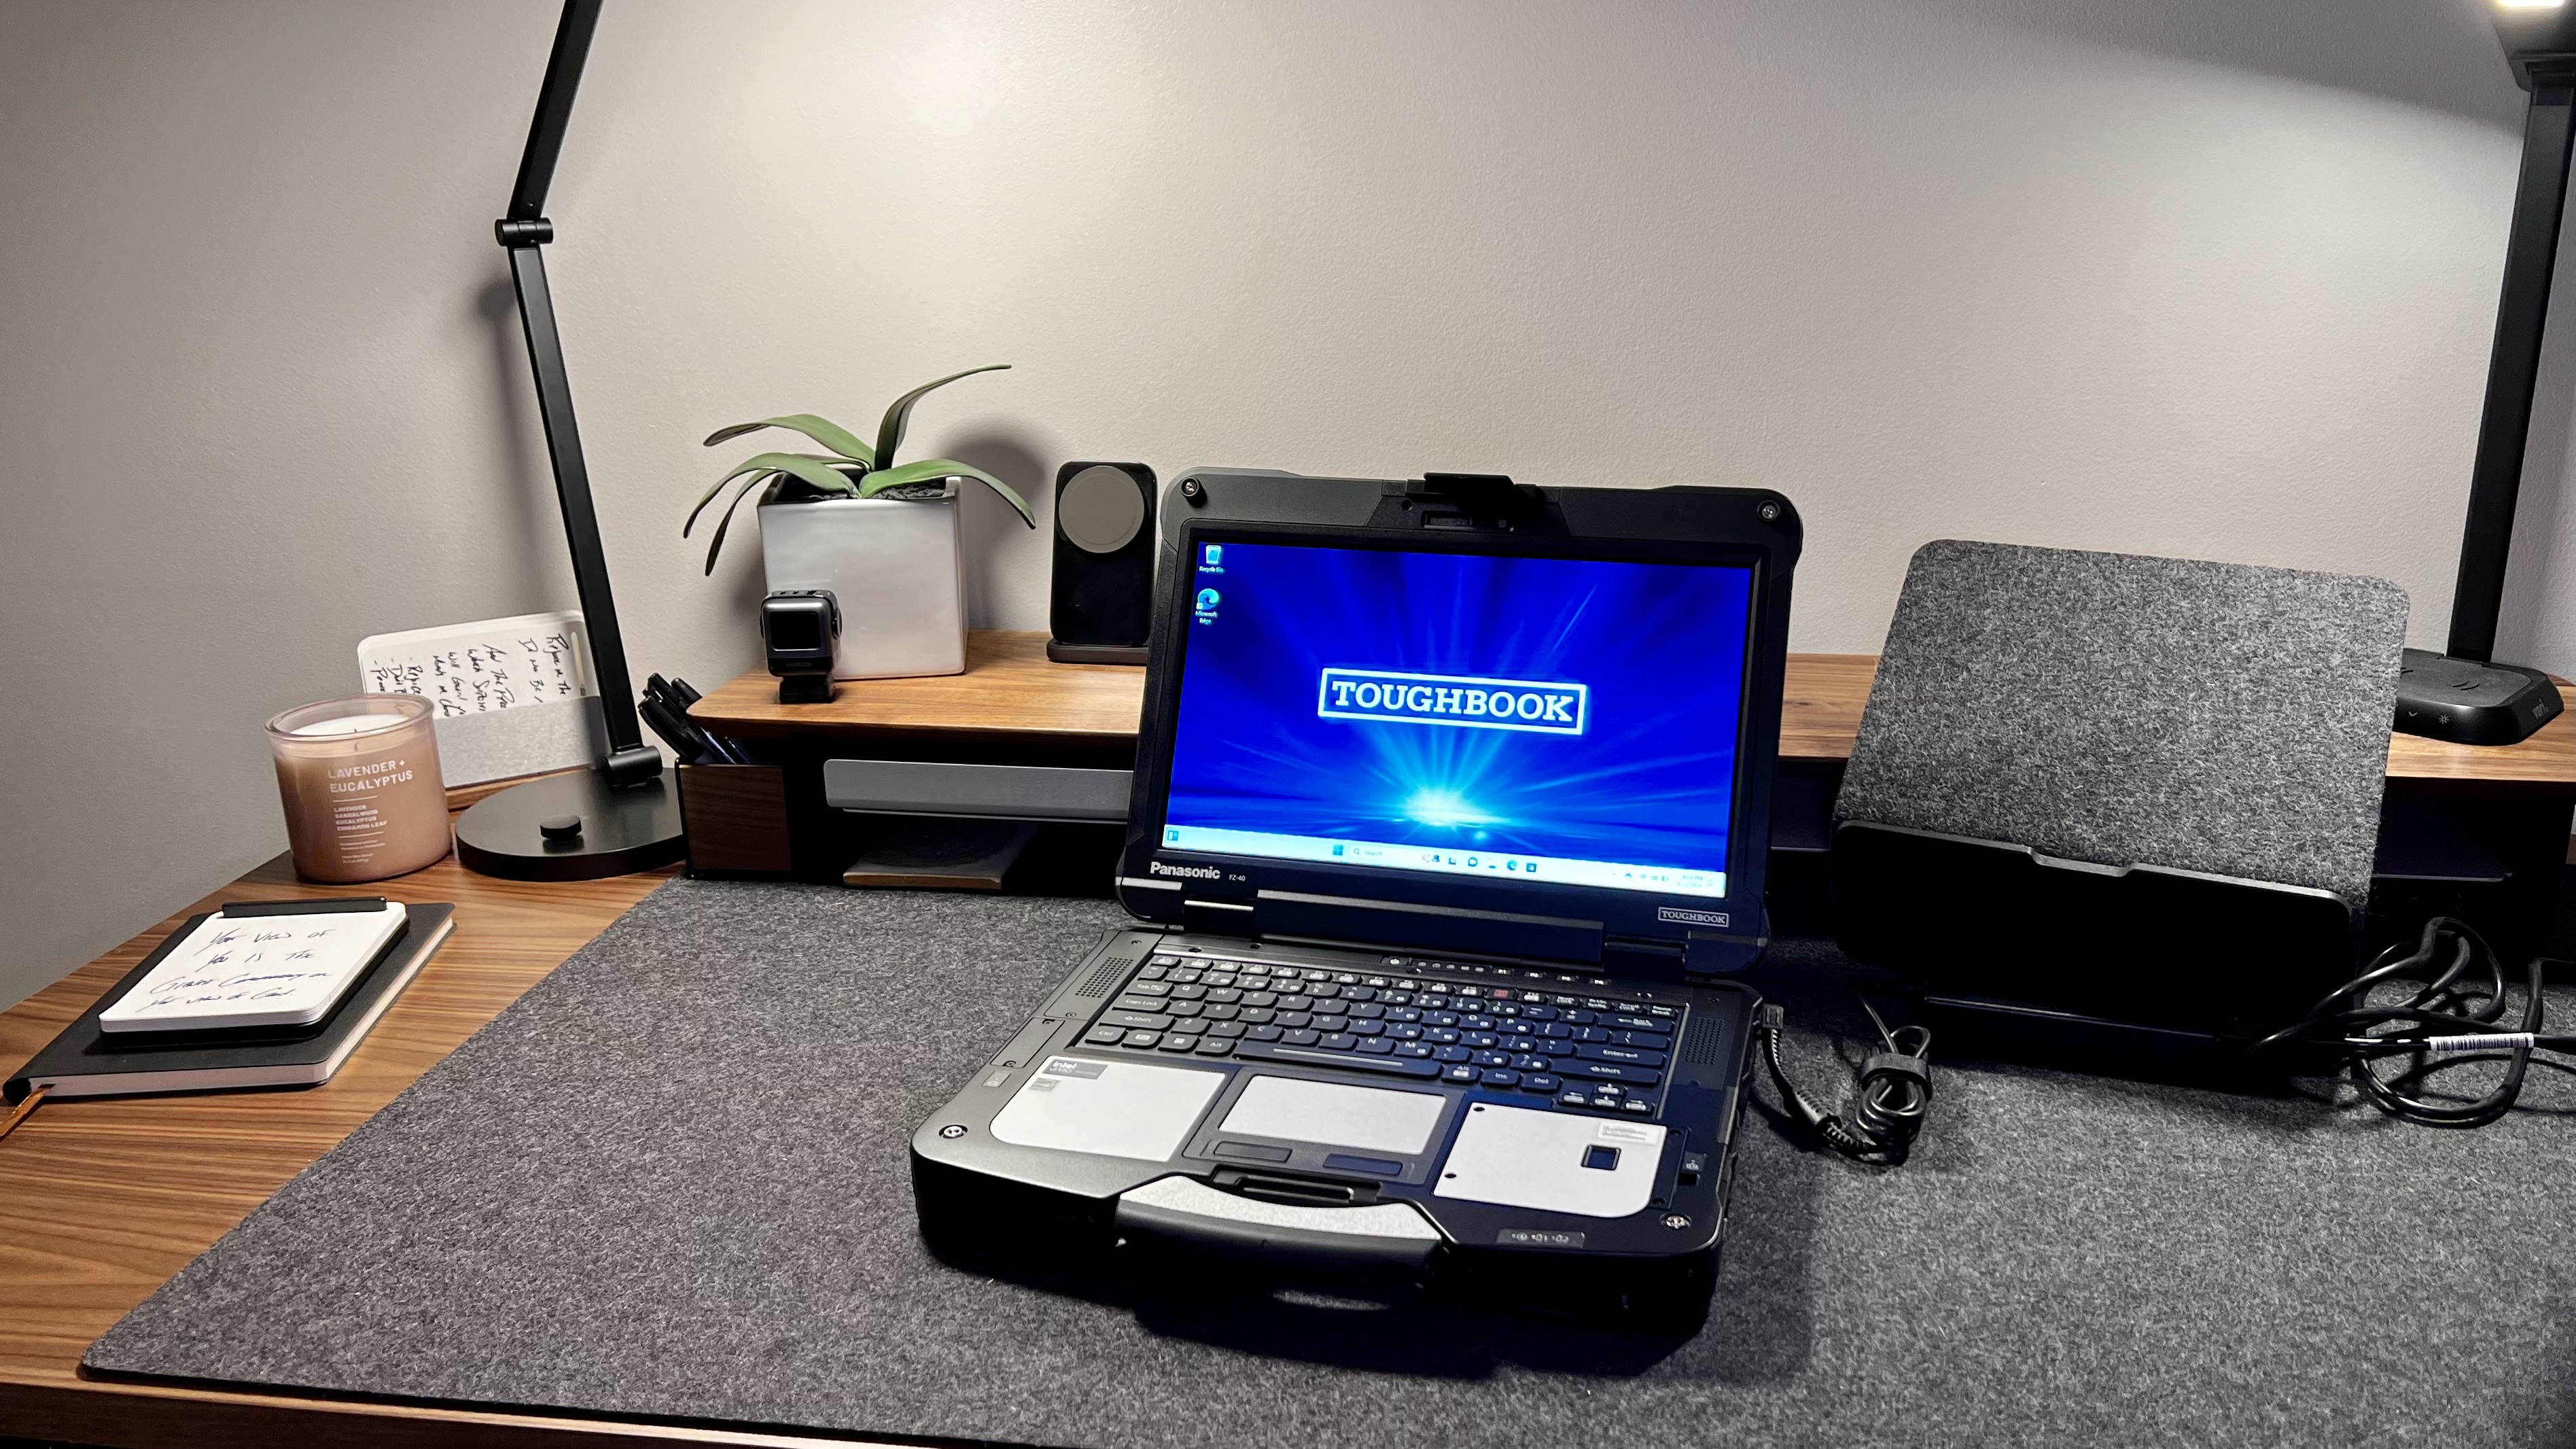
Durable laptops for on-site estimation
While tablets handle data entry, rugged laptops are essential for running complex estimation software directly from the job site. They allow engineers to adjust budget forecasts and compare planned versus actual costs without returning to the office. Look for models with solid-state drives and long battery life to ensure continuous operation during extended site visits.
Mobile printers for immediate documentation
A portable mobile printer turns your tablet or phone into a documentation powerhouse. Instead of relying on handwritten notes that might get lost or misread, you can print work orders, safety checklists, and daily logs on the spot. This physical paper trail is often required for compliance and provides a clear audit trail for your infrastructure projects.


As an Amazon Associate, we may earn from qualifying purchases.
Protective cases and screen protectors
Even the most durable devices need extra protection. Thick, impact-absorbing cases and tempered glass screen protectors are cheap insurance against the inevitable bumps and drops on a busy site. Ensure your cases have glove-friendly cutouts so workers can use the touchscreen without removing their safety gloves, keeping the workflow efficient and safe.
Integrating market price signals
CPI infrastructure models lose predictive power if they rely on static historical averages. To forecast accurately, you must incorporate live market price signals for materials, labor, and energy. This approach treats cost inputs as dynamic variables rather than fixed constants, allowing your model to reflect real-time inflationary pressures.
Embedding live data ensures your projections remain grounded in current economic conditions. For example, steel prices can fluctuate significantly due to global supply chain disruptions or trade policies. By connecting your model to real-time feeds, you capture these shifts immediately, providing a more accurate picture of future project costs.
The U.S. Bureau of Labor Statistics provides the foundational CPI data, but it often lags behind immediate market movements. Supplementing official indices with live commodity prices bridges this gap. This hybrid method combines the breadth of government statistics with the precision of market trading data, offering a robust framework for infrastructure cost management.
Visualizing CPI Trends
Understanding CPI requires more than just looking at a single number; it requires seeing the trend over time. A static CPI value tells you where you are, but a chart tells you where you are going. allows you to overlay Earned Value metrics against actual costs, highlighting variances before they become critical. This visualization is essential for stakeholder reporting, providing a clear, data-driven narrative of project health.
No comments yet. Be the first to share your thoughts!