Defining cpi infrastructure in market analysis
In market research, the phrase "CPI infrastructure" is often treated as a single entity, but it actually spans three distinct analytical domains. To build a reliable model, you must first determine which definition applies to your specific scope. The ambiguity arises because "CPI" is an acronym used by the Consumer Price Index, the Climate Policy Initiative, and various Construction Price Indexes. Each tracks different economic or policy pressures on physical assets.
The most common interpretation involves the Consumer Price Index. Here, CPI infrastructure refers to the physical assets—such as housing, logistics networks, and utilities—that are directly exposed to inflationary pressure. Analysts use this lens to assess how rising consumer costs impact the valuation and operational margins of these assets. This approach treats infrastructure as a passive recipient of macroeconomic trends, where rising input costs squeeze fixed-income returns.
Alternatively, some researchers focus on the Climate Policy Initiative (CPI). In this context, CPI infrastructure refers to the tracking of public and private capital flows toward climate-resilient projects. This is not about price levels, but about capital allocation. It helps investors understand how regulatory frameworks and green policy goals are reshaping the development pipeline for sustainable infrastructure.
A third, more technical view comes from Construction Price Indexes. These indexes measure the actual cost of building materials and labor over time. Unlike the broad Consumer Price Index, these sector-specific metrics provide granular data on supply chain bottlenecks. This data is essential for forecasting project delays and cost overruns in real estate and civil engineering.
Understanding these distinctions is critical for accurate market analysis. Mixing consumer inflation data with construction cost trends can lead to flawed forecasts. By isolating the specific CPI framework relevant to your research, you ensure that your infrastructure analysis rests on a solid, unambiguous foundation.
How CPI Metrics Shape Infrastructure Valuations
Infrastructure assets function differently from standard equities because their cash flows are often tied directly to inflation indices. When pricing contracts over five-year periods, operators frequently set increases as CPI plus a fixed margin. This structure means that as the Consumer Price Index (CPI) rises, the revenue generated by the asset adjusts upward, protecting the real value of the investment against eroding purchasing power.
However, not all CPI measures impact infrastructure equally. The standard CPI-U tracks the average spending of all urban consumers, including volatile categories like used cars and medical care. In contrast, the CPI-R focuses specifically on housing and rental costs, which are more closely aligned with the operational realities of infrastructure assets like utilities, toll roads, and real estate. Using the wrong metric can lead to inaccurate valuation models that either overstate or understate the true inflation pass-through capability of an asset.
| Metric | Primary Focus | Relevance to Infrastructure | Inflation Pass-Through | Volatility Level |
|---|---|---|---|---|
| CPI-U | All Urban Consumers | Moderate | High | Moderate |
| CPI-R | Housing & Renters | High | Very High | Low |
| PCE | Personal Consumption | Low | Low | Low |
| Core CPI | Excludes Food/Energy | Low | Moderate | Low |
Because inflation acts as a direct or indirect pass-through for most infrastructure projects, the immediate impact on valuations is often limited compared to sectors with fixed pricing. Clearbridge Investments notes that this structural advantage helps insulate infrastructure from the negative effects of rising rates, provided the underlying contracts are properly indexed. Investors must therefore distinguish between broad market inflation and the specific cost drivers that actually influence their portfolio's bottom line.
Essential data sources for infrastructure research
High-stakes market analysis demands authoritative data over third-party speculation. Relying on unverified estimates introduces unacceptable risk when evaluating capital-intensive projects. The most credible infrastructure research combines granular government statistics with specialized climate finance tracking.
The U.S. Census Bureau’s Construction Price Indexes (CPI) provide the most reliable baseline for construction cost trends. These indexes track price changes for houses and nonresidential buildings at the national level. Monthly updates derived from the Survey of Construction offer a standardized metric for cost inflation. Analysts use this data to adjust project budgets and forecast long-term viability.
For broader infrastructure investment trends, the Climate Policy Initiative (CPI) offers critical insights into sustainable infrastructure portfolios. Their research highlights how capital flows into climate-resilient projects, providing context that standard economic indexes miss. The CPI Infrastructure Playbook serves as a key reference for understanding the intersection of climate goals and financial returns.

Finally, InfraCap’s comprehensive infrastructure data fills the gap between macroeconomic indicators and project-level realities. By aggregating data on global infrastructure assets, InfraCap allows researchers to benchmark performance against peer groups. Combining Census cost data, Climate Policy Initiative trend analysis, and InfraCap asset metrics creates a robust foundation for market research.
Analyzing market trends with technical tools
Technical analysis helps translate abstract CPI data into actionable market signals. When inflation expectations shift, infrastructure assets often lead the movement because their revenue streams are frequently tied to consumer price indices. Investors use price charts to spot these correlations before they become obvious in broader market reports.
Reading the inflation signal
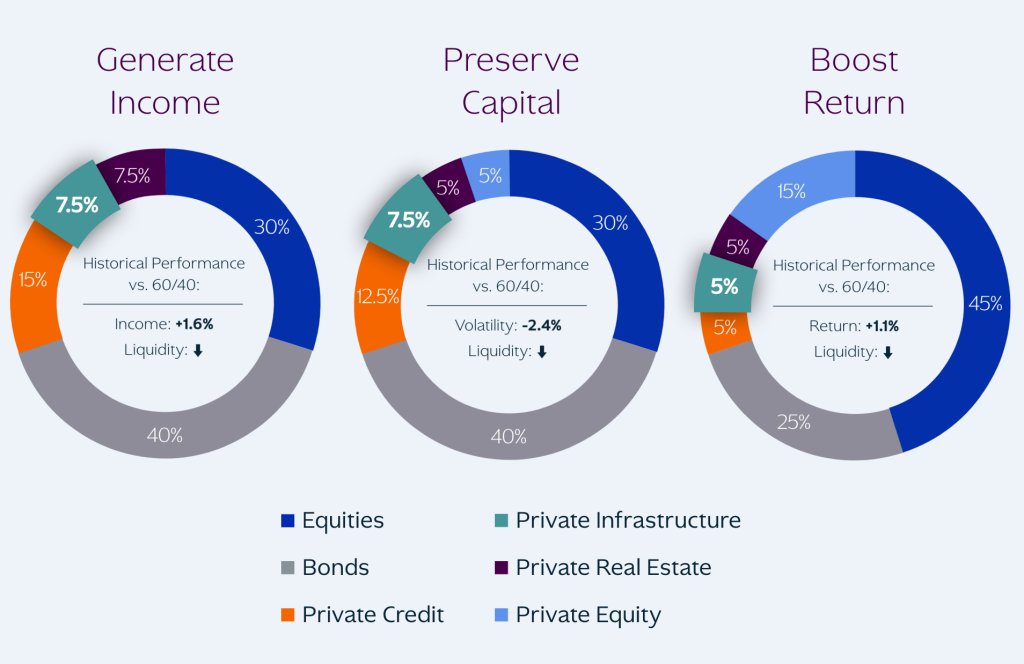
Infrastructure companies often have contracts that adjust prices based on CPI plus a fixed margin. This mechanism protects margins during inflationary periods but can suppress growth if demand falls. A technical chart of an infrastructure ETF like PAVE reveals how these adjustments play out over time. Look for price action that diverges from the broader S&P 500 during high-inflation months. This divergence often signals that infrastructure is acting as a hedge rather than a growth play.
Using provider-backed charts
Static price snapshots are insufficient for this analysis. You need live data to track how infrastructure indices respond to real-time CPI releases. A provider-backed chart allows you to overlay inflation data with asset performance. This visual layer helps identify support and resistance levels that hold during economic stress. For instance, if an infrastructure index holds its value while consumer staples decline, it confirms the asset’s defensive strength.
Recommended tools for infrastructure investors
Selecting the right software and reference materials is essential for accurate CPI infrastructure research. The following tools provide the data depth and analytical frameworks needed to evaluate capital projects and utility assets effectively.
Data and Analytics Platforms
For real-time market data and technical analysis, Bloomberg Terminal and Refinitiv Eikon remain the industry standards. These platforms offer comprehensive CPI tracking, sector-specific indices, and historical datasets critical for long-term infrastructure modeling. They allow investors to overlay commodity trends with project-level financials.
Reference Materials and Frameworks
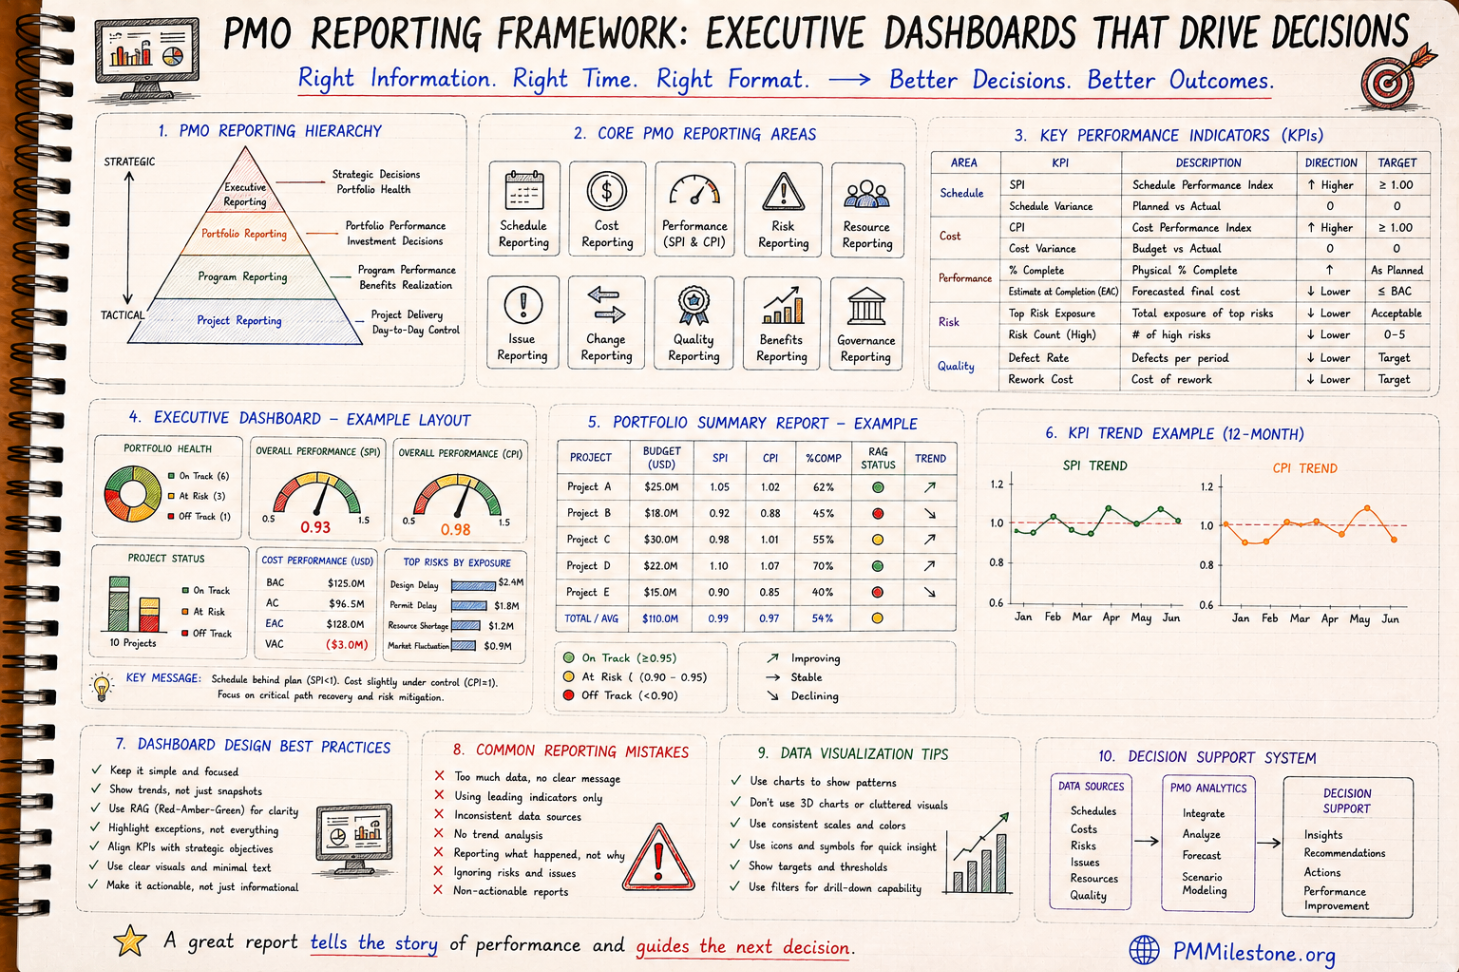
Understanding reporting standards is key to evaluating project health. The Project Management Institute’s PMBOK Guide provides the baseline for project management office (PMO) frameworks, while specialized texts on infrastructure finance offer deeper dives into risk allocation and capital structure. These resources help investors interpret the complex reporting structures typical of large-scale utility projects.
Essential Software for Due Diligence
Specialized engineering and data solutions are available through firms like CPI, which specialize in engineering and data solutions for infrastructure and utility clients. Their platforms often integrate directly with financial models, providing granular data on electrical engineering constraints and utility performance metrics. For physical tools and field guides used in site assessments, the following resources are commonly recommended by field experts:
Build a resilient cpi strategy
A resilient cpi strategy relies on rigorous verification before capital deployment. Construction costs are volatile, and a single data error can distort yield projections by hundreds of basis points. Use this checklist to audit your research workflow and ensure your models reflect reality, not assumptions.
Always trace your data back to the primary issuer. For construction cost indices, the U.S. Census Bureau’s Construction Price Indexes are the gold standard [src-6]. Avoid secondary aggregators that may apply outdated lag factors or smoothing techniques that hide current market shocks.

Check contract language for specific CPI adjustment clauses. Many infrastructure deals use CPI + x spreads to set prices over five-year periods [src-5]. Ensure your model accounts for these annual adjustments rather than assuming static pricing, which fails in high-inflation environments.

Labor and materials often track with housing costs. Compare your construction CPI data against rental and housing indices [src-3]. If your projected cost increases diverge significantly from broader housing trends, investigate the discrepancy before finalizing your underwriting.

Ensure your project aligns with regional planning goals. Climate Policy Initiative notes that infrastructure projects must promote regional planning to secure long-term viability [src-1]. Misaligned projects face higher regulatory risks that CPI adjustments cannot mitigate.
| Data Source | Reliability | Best Use |
|---|---|---|
| U.S. Census Bureau | High | Primary construction cost benchmark |
| Private Aggregators | Medium | Quick market snapshots |
| Housing Indices | High | Labor cost correlation |
Key Takeaways
- Prioritize primary data from the U.S. Census Bureau for construction costs.
- Model annual CPI + x adjustments rather than static pricing.
- Cross-reference with housing indices to validate labor cost assumptions.
- Ensure regional planning alignment to reduce regulatory risk.
Common questions about CPI infrastructure
Understanding the metrics behind construction costs is essential for accurate market research. Below are answers to the most frequent questions regarding Construction Price Indexes (CPI) and their application in infrastructure planning.
What does CPI stand for?
In the context of infrastructure and construction, CPI stands for Construction Price Index. It is a statistical measure that tracks the average change over time in the selling prices of a basket of goods and services related to construction. Unlike the Consumer Price Index (CPI) which measures household inflation, the Construction CPI specifically monitors inputs like labor, materials, and equipment.
What is a CPI in construction?
A Construction CPI is an index that quantifies the cost changes for building projects. It helps contractors and investors adjust bids and forecasts for future projects. For example, if the CPI for residential construction rises, it signals that the cost of lumber, concrete, and labor has increased, requiring budget adjustments for new developments. The U.S. Census Bureau publishes these indexes monthly based on the Survey of Construction (SOC).
What are the 4 types of CPI?
While the Bureau of Labor Statistics defines four types of Consumer Price Indexes (CPI-U, CPI-W, CPI-E, CPI-All Urban), construction professionals typically focus on two primary Construction Price Indexes:
- Residential Construction CPI: Tracks costs for new single-family and multi-family housing.
- Nonresidential Construction CPI: Monitors costs for commercial, industrial, and institutional buildings.
These two categories provide the most granular data for infrastructure investment decisions.
What is the current CPI rate right now?
Construction cost indices fluctuate monthly based on material availability and labor markets. To track the most current trends in construction inflation and infrastructure costs, refer to the latest data from the Bureau of Labor Statistics or specialized reports like the InfraCap CPI.
Helpful gear
Use these product recommendations as a starting point, then choose the size, material, and price point that fit how you actually use the gear.


As an Amazon Associate, we may earn from qualifying purchases.
No comments yet. Be the first to share your thoughts!