What the CPI actually measures
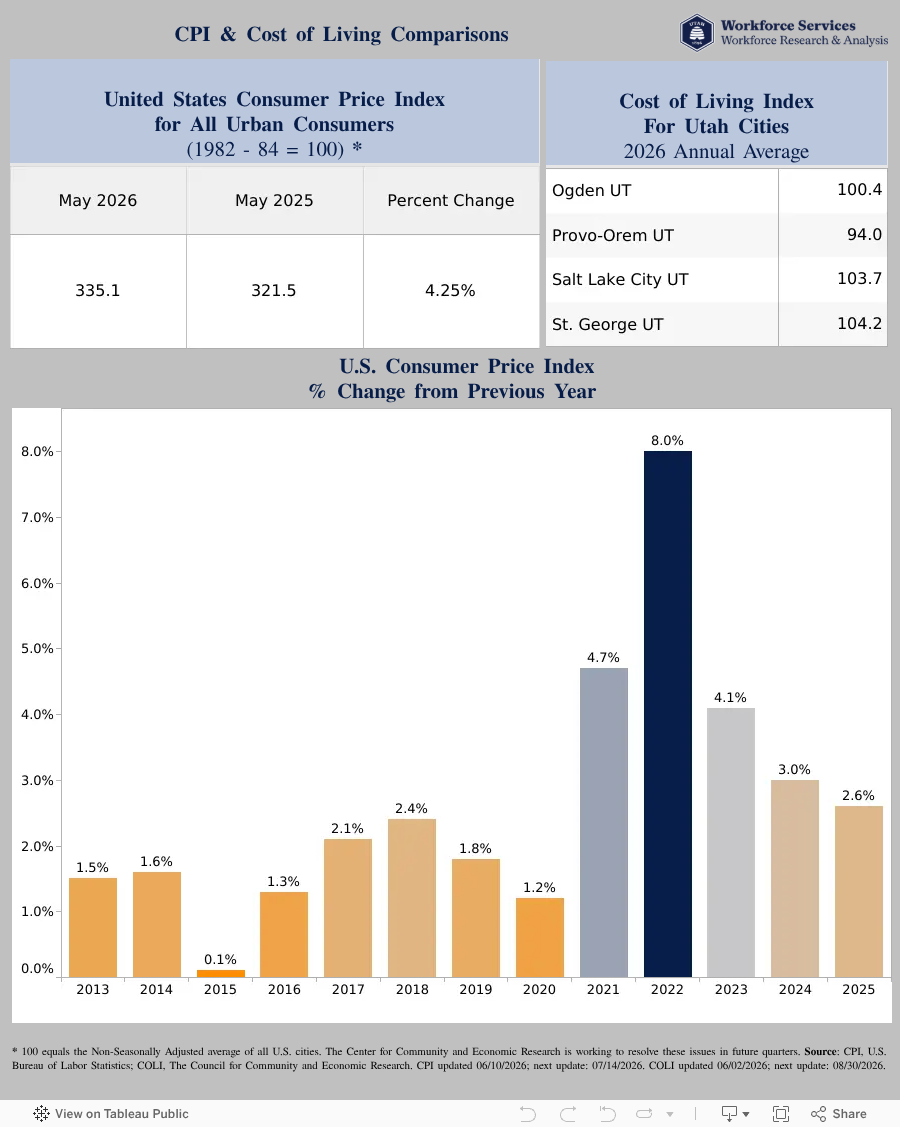
The Consumer Price Index (CPI) is often misunderstood as a broad measure of economic health or corporate profitability. In reality, it tracks only one thing: the change in prices paid by urban consumers for a specific basket of goods and services. It does not measure business operational costs, infrastructure investment, or stock market performance. If you are analyzing market trends, you need to understand that CPI is a thermometer for household purchasing power, not a dashboard for corporate balance sheets.
The Bureau of Labor Statistics (BLS) compiles this data by surveying thousands of retail establishments and service providers across the United States. The index reflects the cost of everyday items—food, energy, housing, and transportation—as experienced by the average consumer. This distinction is critical. When inflation is reported as "high," it means your grocery bill or rent is rising, not necessarily that a company's profit margins are expanding.
Note: CPI reflects consumer purchasing power, not business operational costs.
Understanding this narrow focus helps clarify why CPI data can sometimes feel disconnected from broader market narratives. For instance, a company might report record profits while consumers feel the pinch of inflation because their specific basket of costs has risen faster than the average. The IMF’s Consumer Price Index Manual further clarifies that while global standards exist, the specific composition of the "basket" varies by country, reflecting local consumption habits. This means the CPI is a precise, localized tool for measuring price stability, not a universal gauge of economic strength. For the most accurate and timely data, always refer to the BLS CPI Overview rather than secondary interpretations.
Tracking inflation with live charts
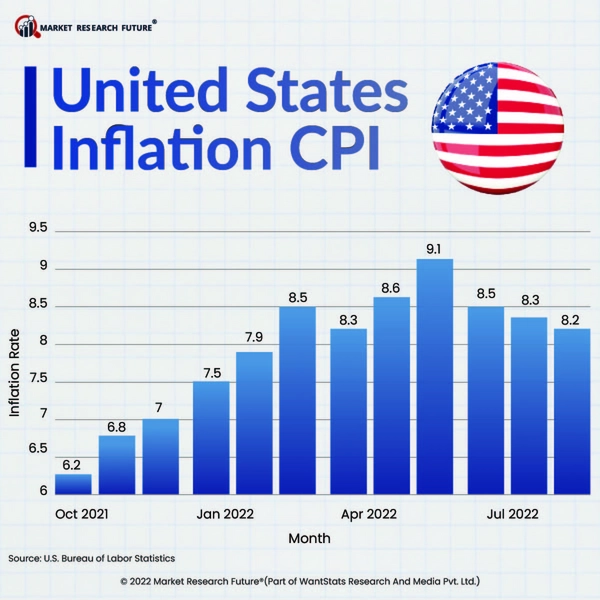
Static CPI reports are historical records, but markets react to real-time shifts. To build an effective CPI guide, you need to visualize these trends as they happen rather than waiting for month-end summaries. Live charts bridge the gap between lagging data and current market sentiment.
The Bureau of Labor Statistics (BLS) releases the official Consumer Price Index, but interpreting that data requires context. By overlaying CPI trends with asset performance, you can see how inflation expectations are priced into the economy. TreasuryDirect provides daily TIPS/CPI data, offering a direct look at how inflation-linked securities are valuing future price changes.
Technical analysis tools help you spot turning points that raw numbers might miss. A moving average crossover on a CPI YoY chart can signal when inflationary pressures are accelerating or cooling. This visual approach allows you to adjust your strategy before the next BLS report drops.
When analyzing these charts, focus on the broader trend rather than monthly noise. A single spike in the CPI data often resolves quickly, but a sustained upward trend requires a different response. Use these live tools to distinguish between temporary volatility and structural inflation changes.
Where to Find Accurate CPI Data
When building a CPI guide for market analysis, your first step is accessing primary sources. Third-party aggregators often lag behind official releases or apply proprietary adjustments that can distort the raw data you need for precise calculations.
Start with the Bureau of Labor Statistics (BLS), the official U.S. source for CPI indexes. The BLS releases the Consumer Price Index for All Urban Consumers (CPI-U) and the CPI for Urban Wage Earners and Clerical Workers (CPI-W) monthly. These datasets are the foundation for adjusting income eligibility, federal tax brackets, and cost-of-living adjustments. For historical context, their data tables provide the long-term trends necessary for spotting inflationary shifts.
For a real-time view of how the market prices in inflation expectations, look at Treasury Inflation-Protected Securities (TIPS). The TreasuryDirect website offers daily index ratios and release schedules that track directly against BLS figures. This data helps you see the market's forward-looking inflation estimates, which often diverge from the backward-looking CPI reports.
For international comparisons, consult the International Labour Organization (ILO). Their CPI manual outlines global standards for compiling price indices, ensuring that data from different countries remains comparable. Using these official channels keeps your analysis grounded in verified statistics rather than speculative estimates.
Tools for deeper CPI analysis
Processing raw inflation data requires more than a basic spreadsheet. Analysts rely on specialized software to handle the heavy lifting of data cleaning, seasonal adjustment, and visualization. While the Bureau of Labor Statistics (BLS) provides the source data, the tools you use to interpret it determine the quality of your market analysis.
For those building custom models or performing deep-dive econometrics, dedicated statistical software is the standard. Packages like R or Python with libraries such as pandas and statsmodels allow for granular control over index calculations and chain-weighting methodologies. These tools are essential when you need to replicate official BLS release methodologies or adjust for specific regional nuances that broad market indices might miss.
If you are tracking CPI trends alongside asset performance, live data widgets are indispensable. Rather than relying on static historical tables that age quickly, embedding provider-backed charts helps you visualize the correlation between inflation shocks and market volatility in real-time. This is particularly useful for identifying lag effects in commodity prices or sector-specific inflation.
For practical guidance on the mechanics of CPI production and integration, the International Monetary Fund (IMF) and the United Nations Economic Commission for Europe (UNECE) publish comprehensive manuals. These resources detail the statistical frameworks behind the indices, offering a deeper understanding of how base effects and basket weights influence the final numbers.
For those looking to build a reference library on economic data analysis, the following resources are widely regarded as essential reading for understanding the intersection of statistical methods and market application.

As an Amazon Associate, we may earn from qualifying purchases.
Build a CPI-Based Investment Strategy
Building a CPI-based investment strategy requires more than just watching the monthly headline number. You need a framework that translates inflation data into concrete portfolio adjustments. The goal isn't to predict every fluctuation but to position your assets to survive periods where purchasing power erodes.
Start by understanding the baseline. The Bureau of Labor Statistics (BLS) releases the Consumer Price Index, which tracks changes in the price level of a market basket of consumer goods and services. This data is the primary input for adjusting income eligibility, federal tax brackets, and cost-of-living allowances. Your investment strategy should mirror this precision, using official releases as triggers rather than speculative forecasts.
Ignore the headline number for a moment and focus on Core CPI, which excludes volatile food and energy prices. This metric often provides a clearer signal of underlying inflation trends. When Core CPI rises persistently, it suggests that inflation is becoming entrenched in the broader economy, requiring a more defensive posture in your portfolio.
Treasury Inflation-Protected Securities (TIPS) are designed to adjust their principal value based on changes in the CPI. TreasuryDirect provides daily index ratios and historical data that can help you gauge real yields. When the spread between nominal Treasuries and TIPS widens, it indicates that investors are demanding higher compensation for expected inflation, signaling a shift in market sentiment.
High inflation often benefits sectors with strong pricing power, such as energy and materials, while hurting consumer discretionary and real estate. Review your sector weights after each CPI release. If inflation is accelerating, consider reducing exposure to companies that cannot pass cost increases to consumers, and increase allocation to assets that historically perform well during inflationary spikes.
Incorporate live widgets like the
to monitor real-time performance of inflation-hedging assets. Combine this with a to see how the broader market reacts to inflation news. These tools help you react to data rather than anticipating it, reducing emotional decision-making.This approach turns raw data into a disciplined routine. By anchoring your decisions to official BLS releases and TIPS metrics, you create a resilient strategy that adapts to the changing cost of living.
No comments yet. Be the first to share your thoughts!