What CPI Analysis Actually Measures
The Consumer Price Index (CPI) tracks the average change over time in prices paid by urban consumers for a market basket of goods and services. Published monthly by the U.S. Bureau of Labor Statistics (BLS), it serves as the primary gauge for consumer inflation in the United States. The index reflects out-of-pocket expenditures for housing, food, energy, transportation, and medical care.
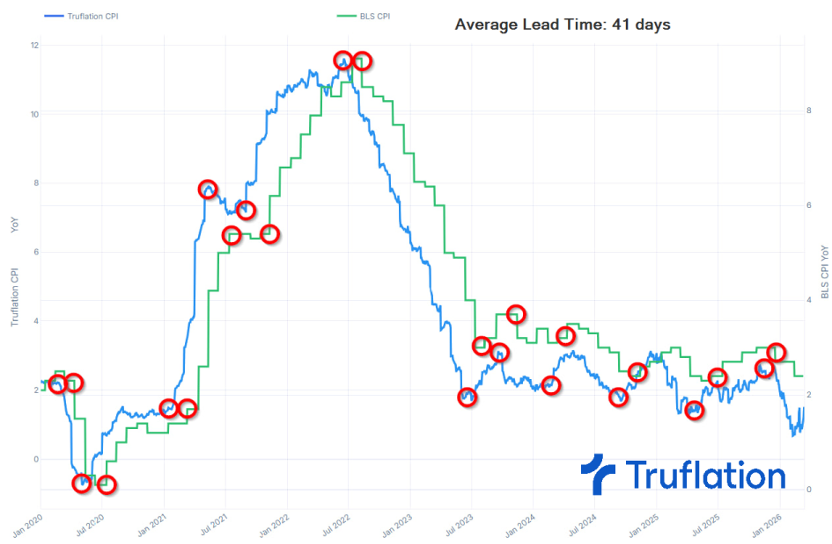
As a lagging indicator, CPI confirms price trends only after they have occurred. This delay creates a gap between current market conditions and official data. By the time the agency releases a CPI report, the data often reflects price movements from several weeks prior. This lag is why traders and analysts seek alternative data sources, such as on-chain metrics, to get a more real-time pulse on economic activity.
The calculation relies on a fixed "basket" of goods, updated periodically to reflect changing consumer habits. While this method provides consistency for year-over-year comparisons, it can struggle to capture rapid shifts in consumer behavior or quality changes in products. Consequently, while the official benchmark remains the standard for inflation, its static nature often necessitates supplementary analysis for timely decision-making.
Why traditional CPI data lags markets
The official inflation gauge, published monthly by the Bureau of Labor Statistics (BLS), remains the primary reference for U.S. inflation, but the data it provides is inherently backward-looking. The agency collects price data from thousands of retail establishments and service providers over the course of a month, then processes and publishes the results roughly six weeks later. This lag creates a structural information asymmetry: by the time the official figure confirms that inflation has risen or fallen, market participants have already adjusted their positions based on real-time signals.
This delay is not a flaw in methodology but a necessary consequence of statistical rigor. The BLS must ensure data quality by weighting the massive dataset to reflect actual consumer spending habits. However, in fast-moving financial markets, this precision comes at the cost of timeliness. While the official report tells us what happened last month, on-chain data and alternative metrics offer a continuous stream of price signals from decentralized exchanges, stablecoin flows, and tokenized asset movements. These signals often react to macroeconomic shifts within hours or days, rather than weeks.
The gap between official releases and real-time market pricing creates a window where traditional investors may be reacting to stale information. On-chain data fills this void by providing a near-instantaneous view of liquidity and asset valuation. Instead of waiting for the government agency to confirm a trend, traders can observe the actual flow of capital and the changing value of assets in the blockchain ecosystem. This immediacy allows for more responsive decision-making, reducing the risk associated with acting on outdated macroeconomic indicators.
On-chain signals as inflation proxies
On-chain data offers a real-time view of economic activity, often moving before official reports. While the government releases the inflation index with a lag, blockchain transactions provide a continuous stream of price discovery and liquidity shifts.
Three key metrics serve as reliable proxies for inflationary pressure: stablecoin velocity, decentralized exchange (DEX) volume, and network gas fees. These indicators reflect how quickly money is circulating and the cost of executing transactions, both of which rise during inflationary periods.
Stablecoin velocity
Stablecoin velocity measures how frequently tokens like USDT or USDC change hands. Inflation often correlates with higher velocity as users move capital quickly to preserve value or seek yield. A sustained increase in velocity suggests growing inflationary expectations or liquidity stress.
DEX volume
Decentralized exchange volume tracks the total value of tokens traded on protocols like Uniswap. Rising DEX volume often signals increased speculative activity and liquidity injection, which can precede broader inflationary trends in traditional markets.
Gas fees
Network gas fees represent the cost of using the blockchain. During periods of high inflation and economic activity, demand for block space increases, driving up fees. This provides a real-time signal of network congestion and economic heat, often aligning with rising consumer prices.
Comparing CPI release dates vs. real-time on-chain metric updates
| Metric | Update Frequency | Source | Inflation Signal |
|---|---|---|---|
| Official CPI | Monthly | Bureau of Labor Statistics | Lagging indicator |
| Stablecoin Velocity | Real-time | Blockchain explorers | Leading indicator |
| DEX Volume | Real-time | Chain analysis tools | Leading indicator |
| Gas Fees | Real-time | Network data feeds | Leading indicator |
Traditional inflation data, published monthly by the Bureau of Labor Statistics, provides a comprehensive but delayed view of price trends. In contrast, on-chain metrics update with every block, offering immediate insights into market sentiment and liquidity conditions. This real-time perspective allows analysts to anticipate inflationary pressures before they appear in official reports.
Integrate on-chain data into your research
Merging traditional CPI reports with on-chain infrastructure data creates a more complete picture of market sentiment. Official inflation figures from the Bureau of Labor Statistics (BLS) provide the baseline for expectations, while on-chain metrics reveal how crypto participants react in real time. This workflow helps you distinguish between macroeconomic signals and immediate market liquidity shifts.
Start with the primary source. Access the BLS Consumer Price Index data directly to verify headline and core inflation figures. Do not rely on secondary summaries for the initial data point, as precision in the release number is critical for accurate correlation.
Place the CPI release date on a technical chart alongside Bitcoin or Ethereum. Use the TechnicalChart below to visualize how price volatility spikes in the hours following the announcement. This visual confirmation helps identify if the market is pricing in the inflation data or reacting to liquidity changes.
Check on-chain metrics for unusual activity immediately after the CPI release. Look for spikes in stablecoin transfers or exchange inflows/outflows. High volume during these windows often indicates institutional rebalancing or leveraged liquidations driven by the inflation surprise.

Compare the on-chain volume against historical CPI events. If the price move is accompanied by low on-chain volume, it may be a short-term liquidity gap rather than a fundamental shift. Only treat the data as a strong signal if both price and on-chain activity align.
This combined approach reduces reliance on lagging indicators. By anchoring your analysis in verified CPI data and validating it with on-chain behavior, you can better anticipate market direction before the broader financial news cycle catches up.
Common misconceptions about CPI data
Analysts often treat the Consumer Price Index as a single, monolithic number, but the Bureau of Labor Statistics publishes several distinct measures that tell different stories. The most frequent error is confusing headline CPI with core CPI, or assuming that on-chain volatility metrics can substitute for official consumer price statistics.
Headline vs. core inflation
Headline CPI includes all items in the market basket, while core CPI excludes food and energy prices. Food and energy are notoriously volatile, driven by weather events, geopolitical conflicts, or supply chain bottlenecks rather than underlying demand trends. When headline numbers spike due to a temporary oil shock, core inflation often remains stable. Relying solely on headline data can lead to premature conclusions about long-term inflationary pressure.
On-chain data is not a replacement
On-chain metrics provide a high-frequency view of crypto market sentiment and liquidity, but they do not measure the cost of living for urban consumers. Official CPI data is based on a representative basket of goods and services tracked by the BLS. While crypto assets may correlate with macro trends, they lack the breadth and regulatory standardization required to replace official statistics. Using on-chain data as a primary proxy for CPI ignores the structural differences in how these markets operate.
Seasonal adjustments matter
Raw CPI figures often include seasonal patterns, such as holiday shopping spikes or summer travel costs. The BLS applies seasonal adjustment factors to smooth these fluctuations and reveal underlying trends. Comparing raw month-over-month changes without accounting for seasonal adjustments can create misleading narratives about inflation acceleration or deceleration.
No comments yet. Be the first to share your thoughts!