What the CPI number actually moves
The biggest mistake retail traders make is staring at the headline CPI number. If you are watching the raw percentage and ignoring the consensus forecast, you are already behind. The market does not care about the absolute level of inflation; it cares about the deviation from what was already priced in.
Think of the CPI release like a starting pistol. The runners are already crouched in their blocks, anticipating the shot. The "trade" isn't the gun going off; it's the split-second reaction to whether someone jumped the start or lagged behind. The market has likely been adjusting its position for weeks based on prior data, Fed commentary, and other inflation metrics like PCE. By the time the Bureau of Labor Statistics (BLS) releases the final figure, the baseline expectation is baked into prices.
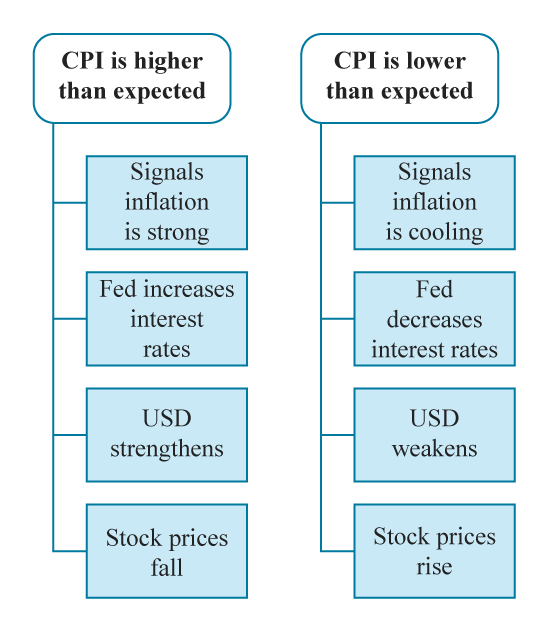
This is why you need to understand the USD correlation baseline. The US dollar (DXY) typically moves inversely to Treasury yields and directly to inflation surprises. A hot CPI print (higher than expected) usually strengthens the dollar as traders price in tighter Fed policy. A cold print (lower than expected) often weakens the dollar as expectations for rate cuts rise.
The primary keyword cluster here revolves around trading inflation data without getting wrecked. Getting wrecked usually happens when traders chase the initial spike. The initial move is often a liquidity grab. The real trend emerges only after the initial volatility settles and institutional flows align with the new data reality. Always compare the actual release against the "consensus" and "prior" figures, not just the headline number.
The Federal Reserve watches core CPI (excluding food and energy) more closely than the headline number. If the core number diverges significantly from the headline, it signals a more persistent inflationary trend, which can trigger a more aggressive market repricing. Understanding this distinction helps you determine the sustainability of the move rather than just reacting to the noise.
The 8:30 AM volatility trap
When the BLS releases the Consumer Price Index at 8:30 AM ET, the market doesn't just move—it glitches. Liquidity dries up, spreads widen to dangerous levels, and algorithmic traders fire thousands of orders in milliseconds. If you are holding a position and trying to react to the headline number in real-time, you are not trading; you are gambling against a system designed to harvest your stop-losses.
The most common mistake retail traders make is chasing the "initial reaction." This is the violent spike that occurs in the first 30 to 60 seconds after the data drops. It is driven by raw, unfiltered algorithmic execution and often lacks genuine directional conviction. By the time you see the price on your screen and click "buy" or "sell," the initial move is usually over. What remains is the "sustained move," which reflects how the market digests the data in the context of broader trends. This second phase is where actual trading opportunities exist.
Waiting for the dust to settle is not about missing out; it is about risk management. Professional traders often wait 15 minutes or more after the release to let the initial volatility bleed off. This allows you to see if the market is reversing or confirming the trend. As noted in trading analyses, the most effective approach is to step back, observe the initial 15-minute reaction, and then look for key levels that hold. Trading the noise at 8:30 AM is a fast way to blow an account.
To understand how this volatility manifests, look at the behavior of the US Dollar Index (DXY) or Gold during recent CPI releases. These assets often show a sharp, jagged spike at the release time followed by a consolidation or reversal. The chart below illustrates this pattern, highlighting the chaotic initial spike versus the clearer trend that emerges later.
The goal is to ignore the first minute and focus on the structure that follows. By avoiding the 8:30 AM trap, you give yourself the clarity to trade the market's true sentiment, not just its shock response.
The Fade and Retest Strategy
The CPI release is a liquidity event. When the data prints, algorithmic execution triggers massive stops, creating a sharp, often misleading initial move. This is where most traders lose money chasing the spike. The fade and retest strategy is about waiting for that initial volatility to exhaust itself, then entering when the price returns to a logical level.
Think of the initial CPI spike like a spring being compressed. The market grabs liquidity on one side—buying if the print is hot, selling if it’s cold—but often lacks the follow-through to sustain the trend. The "fade" is the counter-move against the initial false breakout. The "retest" is the confirmation that the market agrees with your direction.
This approach requires discipline. You are not predicting the CPI number; you are reacting to the market's failure to hold the initial extreme. It shifts the edge from guessing inflation data to reading order flow.
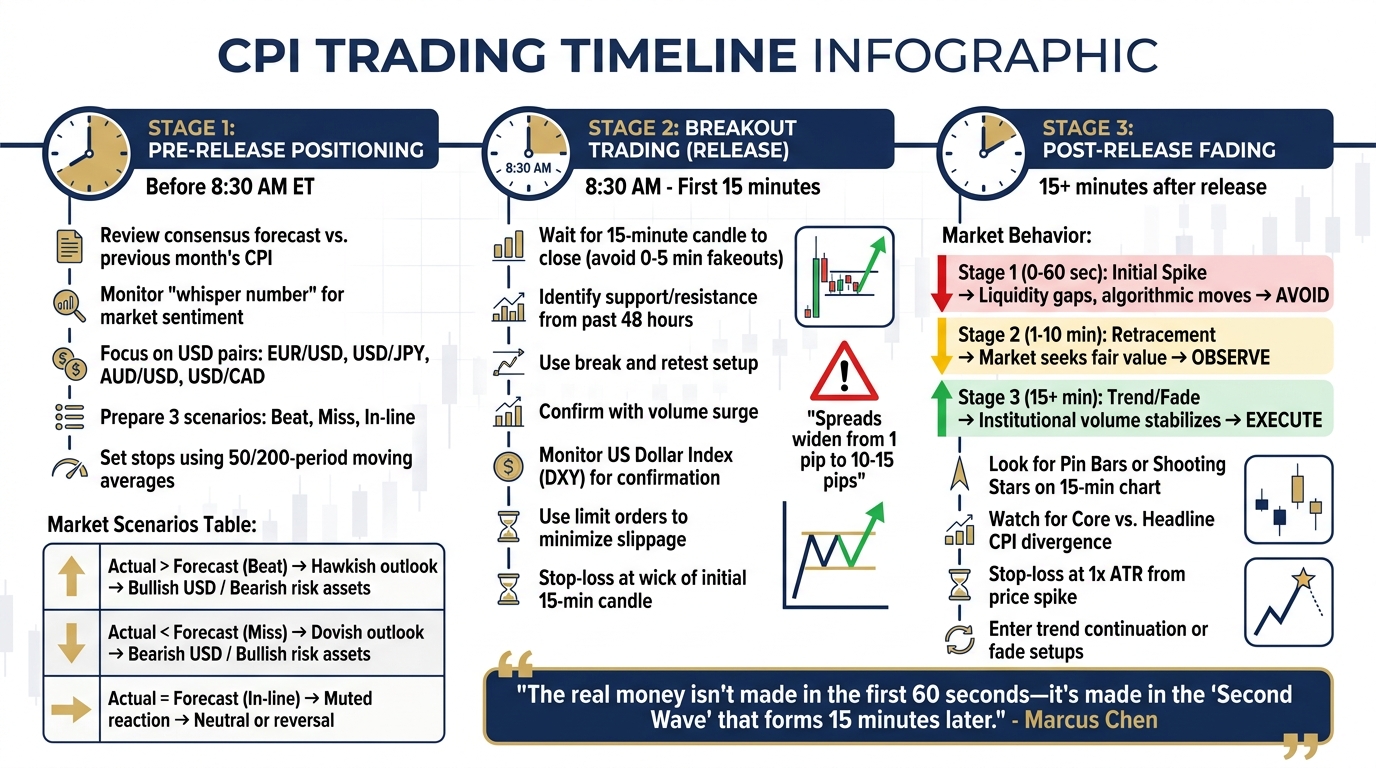
Wait for the BLS data release. Watch for a sharp, one-directional move that breaks a recent high or low. This is the liquidity grab. Do not enter yet. This move is often driven by stop-losses being triggered, not fundamental conviction. If the price spikes up but immediately stalls, it suggests sellers are absorbing the buying pressure.

Observe the price action for 15 to 30 minutes post-release. Look for the initial momentum to die out. The candle should show rejection—long wicks, decreasing volume, or a clear reversal pattern. This confirms that the initial move was a trap. The market is signaling that the extreme price level is not sustainable.
Identify the level where the price broke during the initial move. This is now your entry zone. If the price spiked above resistance and then fell back, that resistance level becomes support. You are waiting for the price to return to this level to confirm the "fade" is valid. This is the point of maximum risk management efficiency.

Once the price touches your marked level, look for a confirmation candle. This could be a bullish engulfing pattern, a hammer, or simply a bounce off the level. Enter your trade in the direction of the reversal. Your stop loss goes just beyond the initial liquidity grab extreme. This keeps your risk tight while the market proves its direction.
The key to this strategy is patience. The initial CPI move is emotional; the retest is mechanical. By waiting for the retest, you avoid the whipsaw that destroys accounts during high-volatility news events. You are trading the market's structure, not the news headline itself.
This method works because it aligns with how institutional orders are filled. Algorithms need liquidity to enter large positions. The initial spike provides that liquidity. The retest allows them to add to their position at a better price. You are simply following the smart money trail after the noise has settled.
Ride the momentum on massive outliers
Trend following the data is not for the faint of heart. It requires you to join the initial move only when the inflation print is a massive outlier and volume confirms the direction. Most traders lose money here by trying to catch the top or bottom too early. You are not predicting; you are reacting to a confirmed shift in market structure.
Think of this as surfing a tsunami, not a wave. A minor miss or beat usually results in a quick spike and fade. But when the Consumer Price Index deviates significantly from the consensus—often driven by sticky core services or energy shocks—the market needs time to reprice. This is where the real money is made, provided you have the discipline to wait for the breakout.
Do not enter during the first 30 seconds. The initial volatility is often noise from algorithmic trading. Wait for the price to form a clear direction on the 5-minute or 15-minute chart. Look for a sustained break above or below the pre-release range.
A genuine trend requires volume. If the price moves up but volume is declining, it’s likely a trap. Use a momentum indicator like the RSI to confirm strength. If the RSI is above 70 in an uptrend, the momentum is strong enough to sustain the move.

High stakes demand high discipline. Place your stop loss just below the initial spike low (for longs) or above the high (for shorts). If the market reverses quickly, you want out immediately. Do not hope for a rebound.
This strategy relies on the market’s reaction to the Federal Reserve’s likely policy response. A hotter-than-expected CPI often signals that the Fed will keep rates higher for longer, strengthening the dollar and pressuring equities. Conversely, a cooler print may spark relief rallies. Always check the latest Federal Reserve statements to understand the current policy bias before entering.
The key is patience. If the data is a mild miss or beat, stay on the sidelines. Only engage when the outlier is large enough to force a fundamental repricing of assets. This is a high-risk, high-reward approach that demands strict risk management and emotional control.
Keep Risk Small When the Data Drops
CPI releases are not the time to prove how big your position can be. The market moves on the spread between the actual number and the consensus forecast, and that spread can widen instantly in either direction. If you treat every release like a lottery ticket, you will eventually get wrecked. The goal here is mechanical survival, not heroic gains.
Start by cutting your normal position size in half. If you usually trade 1% of your account on a setup, trade 0.5% on CPI day. This gives you room to breathe when the initial spike reverses. You can always add to a winning position after the dust settles, but you cannot add to a margin call.
Your stop-loss needs to be wider, not tighter. Standard technical stops often get hunted in the first 60 seconds of volatility. Instead of placing a stop just below a recent low, use a time-based or volatility-based exit. If the trade doesn't move in your favor within five minutes, get out. Let the market prove its direction before you commit more capital.

Check your correlation assets before you enter. If you are trading USD pairs, look at what the S&P 500 and Gold are doing. Sometimes the dollar moves against the grain of equities, creating a false signal that traps retail traders. If the broader market is crashing, a "bullish" CPI print might just mean the Fed is going to cut rates to save the economy, which is actually bearish for the dollar in the long run.
-
Reduce leverage to 50% of normal size
-
Widen stop-losses to avoid initial volatility spikes
-
Set a 5-minute time-based exit rule
-
Check S&P 500 and Gold for conflicting signals
-
Define your exact exit price before the 8:30 AM release
The Federal Reserve and the BLS provide the data, but they don't care about your stop-loss. Your job is to respect the chaos. Wait for the initial 15-minute reaction to pass, see where price stabilizes, and then decide if you want to join the trend. Most blowups happen because traders try to catch the falling knife at the exact second the number drops.
Common questions about CPI trading
Understanding how inflation data moves markets is the first step to surviving the volatility. Here are the most frequent questions traders ask when preparing for a CPI release.
Remember that mechanical execution matters more than prediction. The market often moves before the data is even fully released, so having a plan for both outcomes is essential.
No comments yet. Be the first to share your thoughts!