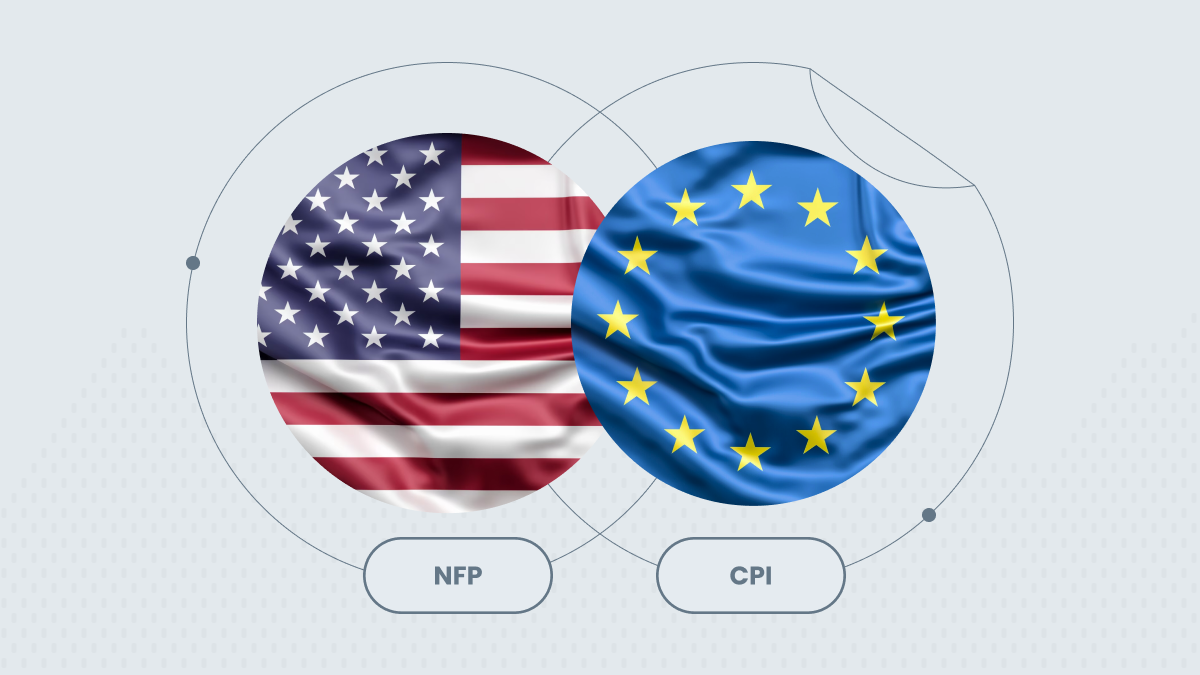
What CPI data actually moves
The Consumer Price Index (CPI) is the headline number that tracks the cost of a basket of goods and services over time. But in the markets, the raw number matters far less than the surprise. Volatility spikes when the actual release deviates from the consensus forecast—the average prediction made by economists before the data drops. This gap between expectation and reality is what moves prices, not the absolute level of inflation.
Think of the market as a pricing engine that constantly adjusts for future inflation. When the data confirms those expectations, the move is often muted because traders have already positioned for it. It is the unexpected shift—whether hotter or cooler than anticipated—that forces a rapid repricing of assets. This is why trading CPI without a strategy is essentially gambling; you are betting on a binary outcome with no edge.
To navigate this, you need to understand that the initial reaction at 8:30 a.m. ET is often chaotic and driven by algorithmic execution. The true direction usually emerges after the initial dust settles. By focusing on the deviation from consensus rather than the headline number itself, you can separate signal from noise and manage risk effectively in high-stakes environments.
Retail traps versus smart money entries
The Consumer Price Index (CPI) release at 8:30 AM ET is a high-volatility event that separates disciplined traders from those who get swept up in the noise. Most retail traders fall into the trap of chasing the initial spike, entering positions the moment the data hits the wire. This approach is dangerous because the first few minutes of price action are often driven by algorithmic overreactions and liquidity gaps rather than genuine market sentiment. By the time a retail trader sees the candle form, the institutional order flow has often already shifted, leaving late entrants holding the bag when the price reverses.
Smart money traders take a different approach: they wait. Instead of reacting to the headline number, they observe how the market digests the data over the first 15 to 30 minutes. This "post-reaction" or "fade" strategy relies on identifying the true equilibrium price after the initial volatility subsides. Institutional traders look for signs of exhaustion in the initial move, such as long wicks or a failure to break key technical levels, before entering positions that align with the broader trend rather than the headline shock.
The difference in risk management between these two approaches is stark. Retail traders often use tight stop-losses that get triggered by the initial wick, only to watch the price move in their intended direction seconds later. Smart money traders use wider stops or wait for confirmation, accepting lower leverage in exchange for higher probability setups. This patience allows them to avoid the "whipsaw" effect that plagues high-frequency trading during news events.
The table below compares the mechanics of these two strategies, highlighting why waiting for the post-reaction phase often yields better risk-adjusted returns.
| Strategy | Entry Timing | Risk Profile | Typical Win Rate |
|---|---|---|---|
| Retail (Chase) | 0-5 minutes post-release | High (slippage, wick-outs) | Low (often <40%) |
| Smart Money (Fade) | 15-60 minutes post-release | Medium (controlled stops) | Higher (often >55%) |
| Institutional (Trend) | Next day or session close | Low (structural levels) | Variable (depends on trend) |
The bond market, particularly the 10-year Treasury yield, often provides the clearest signal of how institutions are positioning themselves. While equities may react emotionally to inflation headlines, the bond market’s reaction tends to be more measured and reflective of long-term rate expectations. Monitoring the US10Y alongside the S&P 500 or Nasdaq can help you confirm whether the CPI-driven move has institutional backing or is merely a speculative frenzy.
Building a backtested CPI framework
A rule-based approach removes the guesswork from CPI trading. Instead of reacting to headlines, you define strict entry and exit criteria based on the deviation between the consensus forecast and the actual release. This method relies on historical data to prove that a specific reaction pattern exists, turning a chaotic news event into a repeatable mechanical process.
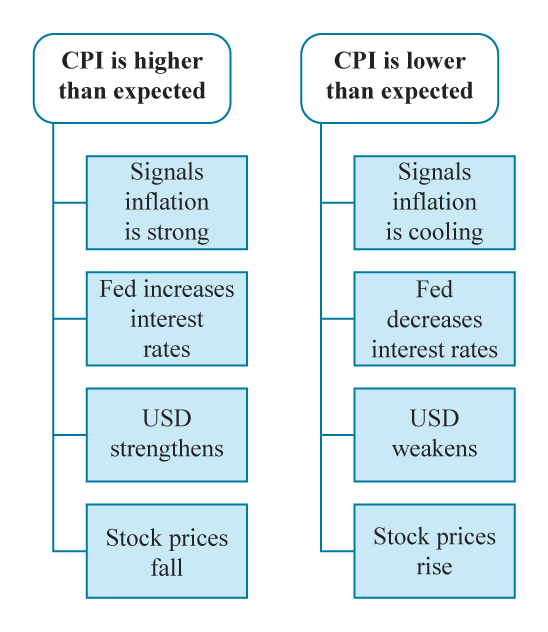
The core of the strategy is simple: measure the surprise. When the Bureau of Labor Statistics releases the data, compare the actual inflation rate to the market expectation. If the difference exceeds your predefined threshold—say, a 0.2% deviation—you trigger a trade. The direction depends on your hypothesis; many traders assume that hotter-than-expected inflation will strengthen the dollar and pressure risk assets, while cooler data does the opposite.
However, a backtest is only as good as its validation. A common pitfall is overfitting: tweaking your parameters until they look perfect on past data. This creates a strategy that fails in live markets because it captures noise rather than signal. To avoid this, you must rigorously test your rules on out-of-sample data—periods the model has never seen before. If the strategy doesn't hold up on unseen data, it is likely curve-fitted and should be discarded.
Risk management is the final pillar. CPI events can cause slippage and widened spreads, especially in the first few seconds of volatility. Your framework must include hard stops and position sizing limits that account for this extreme variance. Without these safeguards, even a statistically valid edge can be wiped out by a single bad execution.

Determine the minimum difference between forecast and actual CPI that triggers a trade. This number should be based on historical volatility, not arbitrary guesses. A threshold that is too tight will result in false signals; one that is too wide will miss high-probability setups.
Establish clear instructions for market direction. Will you go long or short based on whether inflation beats or misses expectations? Define which asset class you are trading (e.g., S&P 500, DXY, or 10-year yields) and the exact entry mechanism, such as a limit order placed before the release or a market order after confirmation.
Split your historical data into in-sample (training) and out-of-sample (testing) sets. Optimize your parameters only on the training set. Then, run those fixed parameters against the out-of-sample data to verify robustness. If performance degrades significantly, your strategy is overfit.
Define maximum position size and stop-loss levels before the trade executes. CPI releases can cause gap risk, so consider using guaranteed stops if available. Ensure your risk-to-reward ratio remains positive even if the initial move reverses quickly after the volatility spike.
Essential Tools for Tracking Inflation Signals
Trading CPI data without a dedicated signal stack is like driving in fog without headlights. You need reliable inputs to gauge market positioning before the data drops. This section outlines the primary tools and indicators that professional traders use to filter noise and manage risk during high-stakes inflation releases.
Treasury Yields and the VIX
The 10-year Treasury yield remains the most direct barometer of long-term inflation expectations. Watch for divergence between nominal yields and TIPS (Treasury Inflation-Protected Securities); a widening spread often signals rising inflation anxiety. Simultaneously, the CBOE Volatility Index (VIX) acts as a sentiment gauge. A spike in the VIX ahead of CPI release typically indicates institutional hedging against downside risk.
Crypto Correlation Metrics
Bitcoin and other major cryptocurrencies have increasingly correlated with risk-on assets, including the Nasdaq. During CPI events, monitor the Bitcoin-Dominance (BTC.D) and stablecoin liquidity ratios. Sudden drops in stablecoin market cap often precede volatility spikes, serving as an early warning for broader market liquidity contraction.
Recommended Resources
For traders looking to deepen their understanding of macro signals and CPI analysis, the following resources provide structured learning paths.


As an Amazon Associate, we may earn from qualifying purchases.
Risk management for high-volatility days
CPI releases are not trading sessions; they are liquidity events. The spread widening and slippage during the initial seconds can turn a profitable technical setup into a blown account. To survive, you must treat the release as a blackout period rather than an opportunity window.
The primary rule is simple: do not hold directional positions through the data drop. Volatility spikes are unpredictable in direction but guaranteed in magnitude. A 0.1% move in the CPI headline can trigger a 1% move in the S&P 500 futures. If you are long, a hot print stops you out instantly. If you are short, a cold print triggers a short squeeze. The only way to avoid being the liquidity for these moves is to step aside.
Reduce leverage before the clock strikes 8:30 AM ET. If you typically trade with 10x leverage, cut it to 2x or close positions entirely. High volatility amplifies margin calls. A rapid wick down can liquidate your position before the market even finds its equilibrium. Protecting capital is more important than catching the initial spike.
Pre-CPI Release Risk Management Checklist
-
Close all directional futures and equity positions 5 minutes before the release.
-
Reduce leverage on any remaining hedging or options exposure.
-
Verify stop-loss orders are not set too tight; spreads will widen significantly.
-
Disable auto-trading bots to prevent algorithmic entries during chaotic price action.
-
Wait for the initial 15-minute volatility contraction before re-evaluating the trend.
No comments yet. Be the first to share your thoughts!