Why CPI Analysis Matters Now
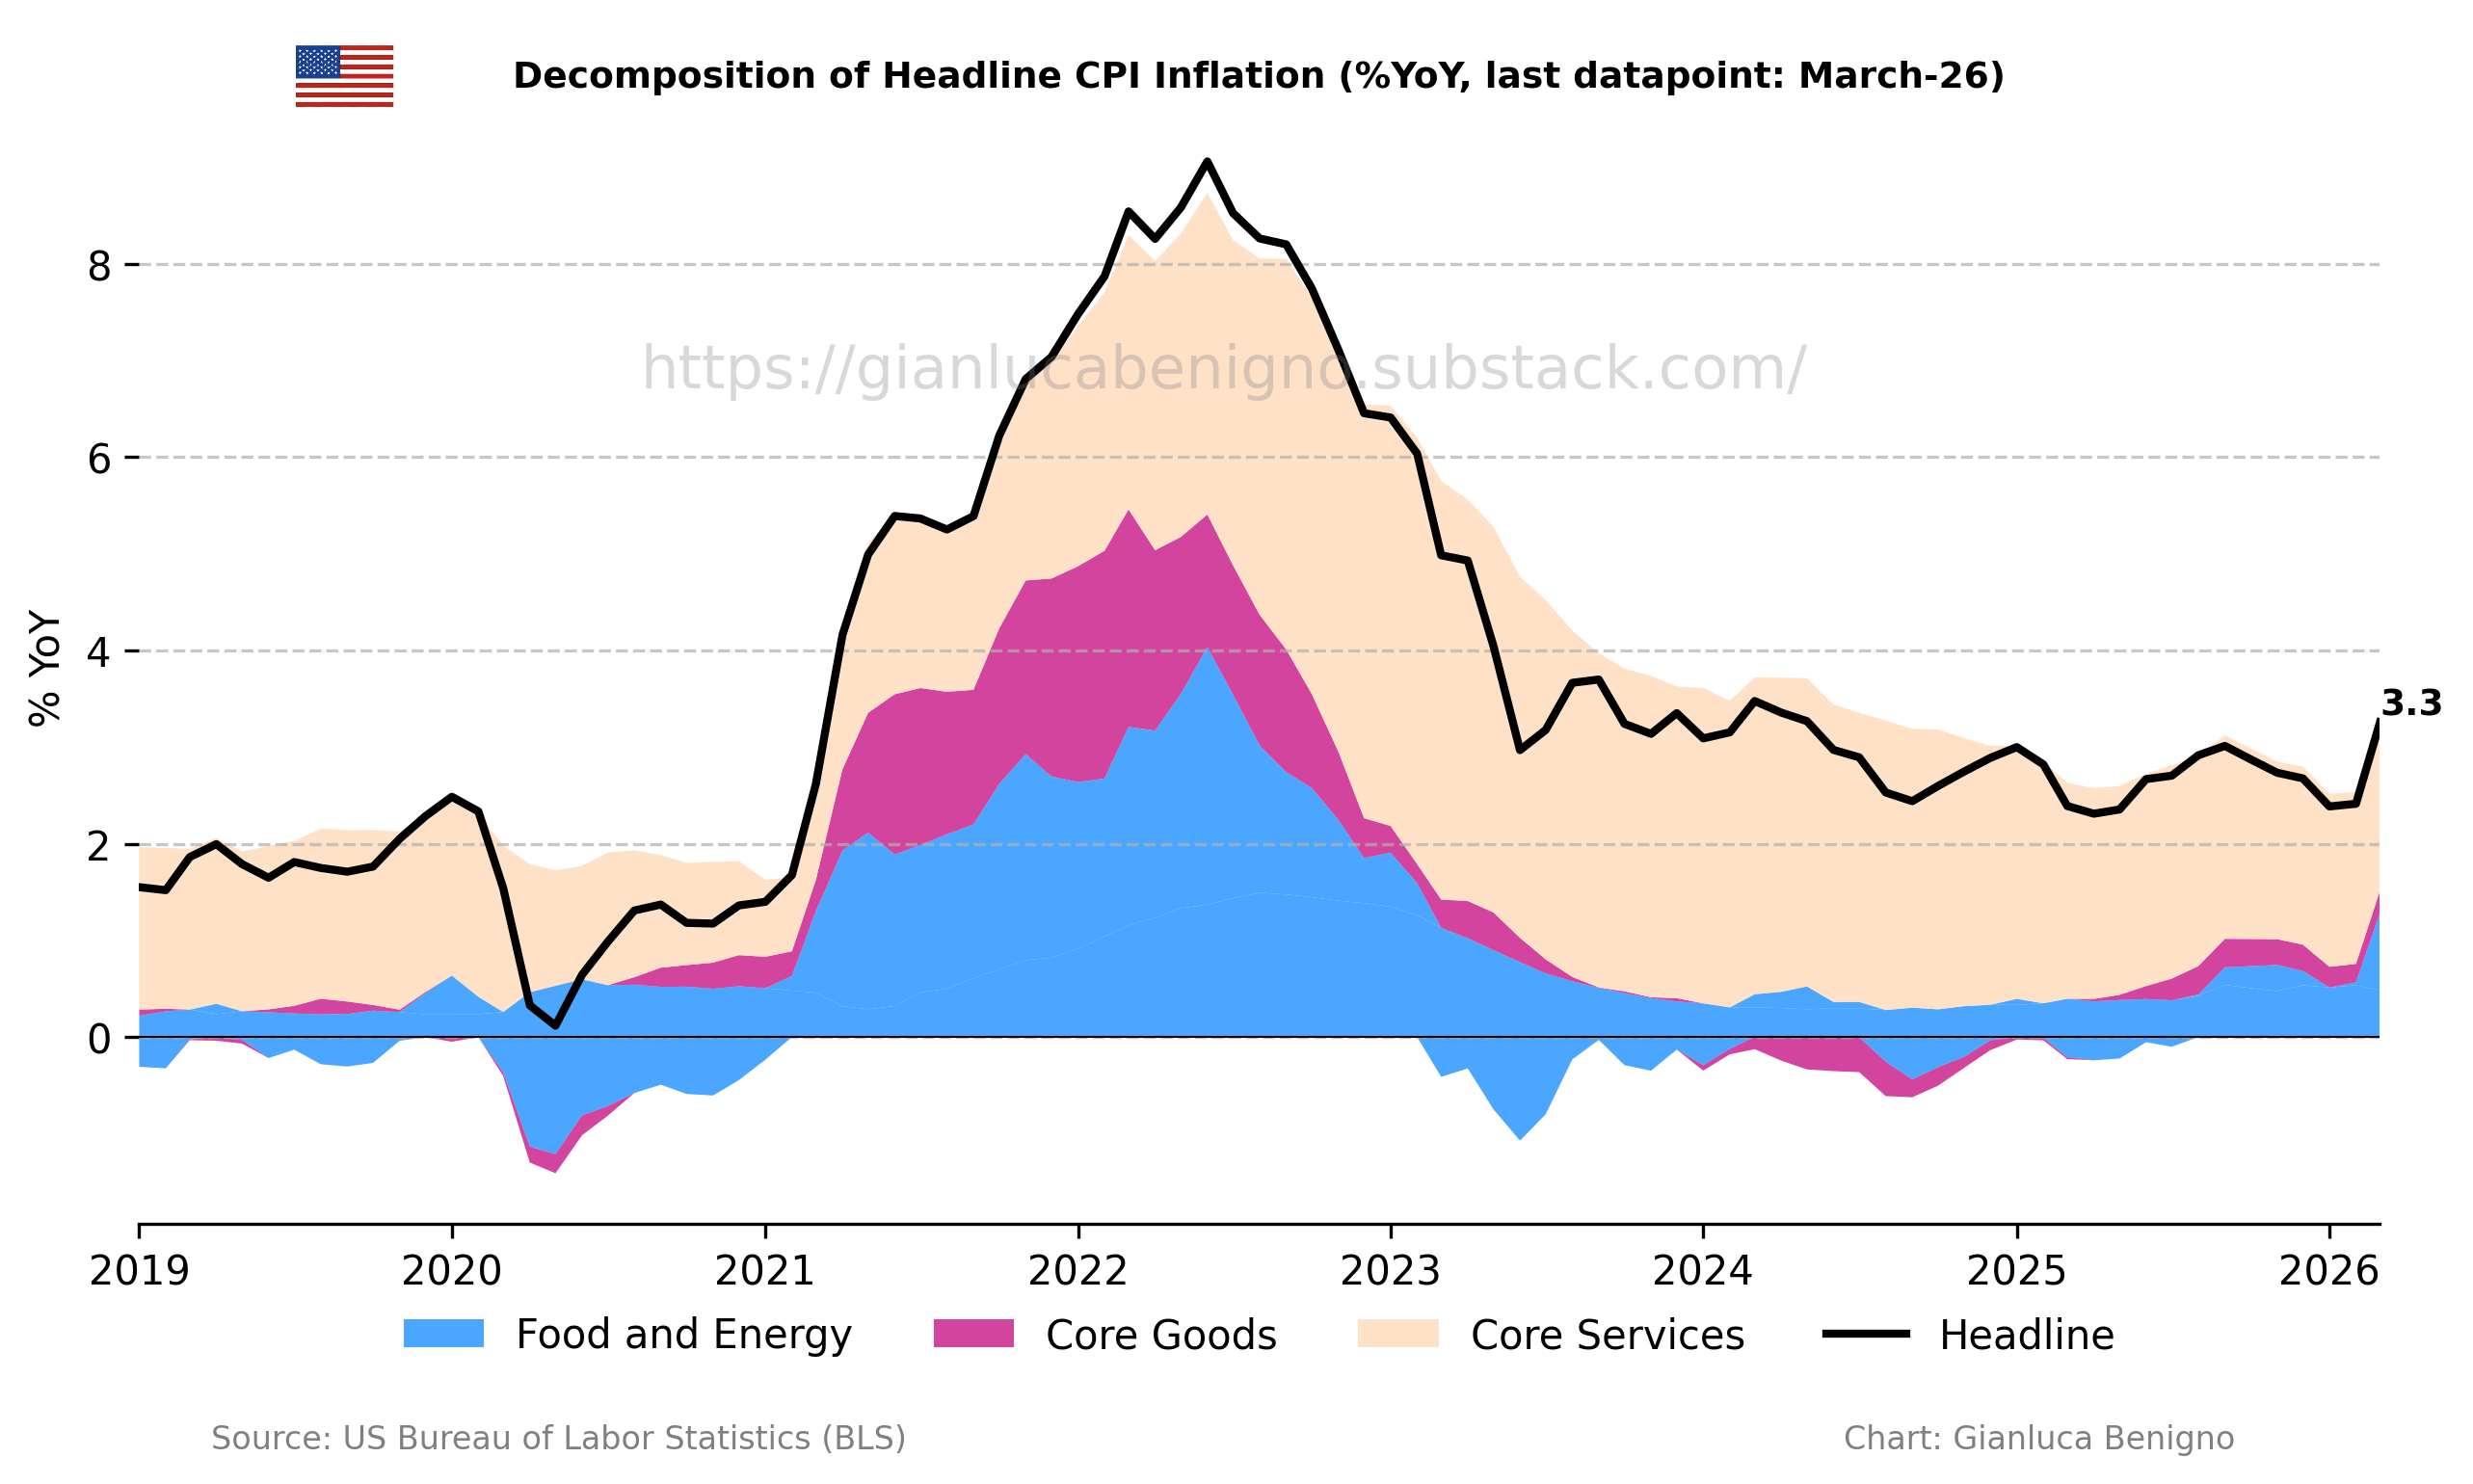
Inflation data has shifted from a background economic indicator to the primary driver of asset allocation in 2026. When the Chained Consumer Price Index for All Urban Consumers (C-CPI-U) increased 3.3 percent over the last 12 months, it signaled that price pressures remain entrenched despite broader market volatility BLS, July 2026. This persistent inflation changes how investors must approach both traditional equities and digital assets.
Accurate CPI analysis is no longer just about understanding consumer costs; it is about predicting the trajectory of liquidity. Traditional markets react to these figures through interest rate expectations, but crypto assets often respond to the real yield environment and currency debasement fears. Ignoring the nuances of inflation data leaves capital exposed to sudden repricing events that can wipe out gains in volatile sectors.
The following sections break down the specific tools and data sources needed to navigate this high-stakes environment. By focusing on official sources like the Bureau of Labor Statistics (BLS) and Federal Reserve Economic Data (FRED), analysts can cut through the noise of speculative commentary and make decisions based on verified economic reality.
Accessing Official BLS Data
Start your analysis with the U.S. Bureau of Labor Statistics (BLS). The BLS is the primary source for Consumer Price Index data, publishing the raw numbers that drive market expectations. Before applying complex models or looking for alternative indicators, you need to understand what the government actually reports. The BLS CPI page hosts the official releases, methodological notes, and historical tables.
The most critical series for market research is CPIAUCSL, which tracks the Consumer Price Index for All Urban Consumers. This broad measure captures price changes across food, housing, transportation, and medical care. It serves as the baseline for inflation adjustments and Federal Reserve policy decisions. When you see headlines about "headline inflation," they are almost always referencing this specific dataset.
For historical context and interactive charting, the Federal Reserve Economic Data (FRED) database provides a clean interface to BLS data. FRED allows you to overlay CPIAUCSL with other economic indicators, making it easier to spot long-term trends. You can download the data directly or embed charts into your reports. Using these official sources ensures your research rests on verified data rather than third-party estimates.
To visualize the long-term trajectory of consumer prices, use the chart below. It displays the CPIAUCSL series, helping you identify structural shifts in inflation rather than getting lost in monthly noise.
Using FRED for Historical Context
Federal Reserve Economic Data (FRED) serves as the primary archive for U.S. macroeconomic indicators, offering a transparent window into long-term inflation trends. Unlike fleeting news headlines, FRED provides continuous, standardized data series that allow researchers to anchor current Consumer Price Index (CPI) readings against decades of economic history.
Access the core series CPIAUCSL to view the seasonally adjusted index for all urban consumers. This dataset forms the backbone of most inflation analyses, tracking price changes across food, energy, housing, and medical care. By overlaying today’s CPI figures on FRED’s historical chart, you can instantly visualize where current prices sit relative to the 1980s volatility or the post-2008 recovery period.
For a more granular view, switch to the monthly percent change series CPIAUCSL1M. This metric strips away the cumulative index to show the velocity of price shifts, making it easier to identify acceleration or deceleration in specific sectors. Comparing the current month’s rate against the five-year average helps determine if the market is experiencing temporary noise or a structural shift in cost dynamics.
| Series | Label | Frequency |
|---|---|---|
| CPIAUCSL | CPI for All Urban Consumers | Monthly |
| CPIAUCSL1M | CPI Monthly Percent Change | Monthly |
| CPILFESL | CPI for All Items Less Food and Energy | Monthly |
Connecting CPI to On-Chain Data
Traditional CPI reports from the Bureau of Labor Statistics (BLS) and Federal Reserve Economic Data (FRED) provide a lagging view of inflation. By the time official numbers are released, market participants have often already adjusted their positions. On-chain data offers a real-time alternative, capturing how crypto users react to inflation signals as they happen.
Bitcoin and Ethereum serve as primary inflation hedges in Web3, and their on-chain metrics reflect shifting sentiment. When CPI data suggests rising prices, investors may move funds into stablecoins or accumulate Bitcoin. Tracking these flows helps analysts anticipate market moves before official reports arrive.
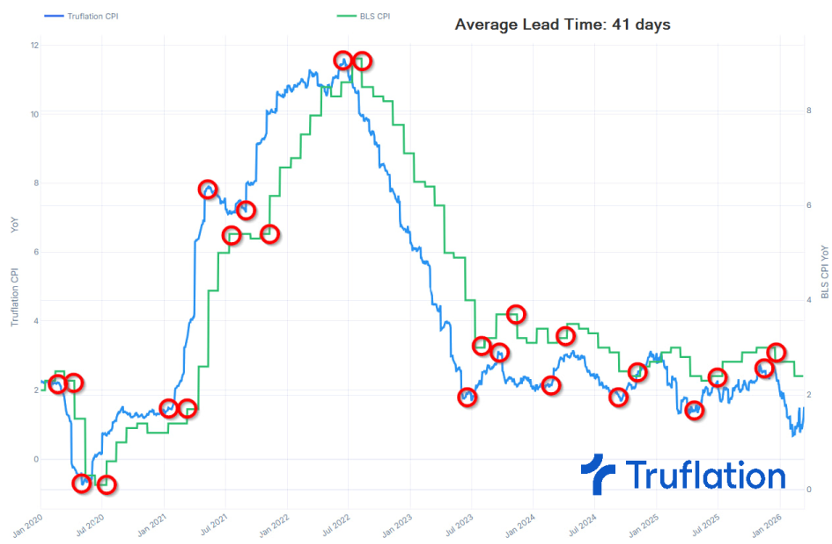
On-chain inflation indicators often lead the official BLS CPI measure. Tools like Truflation provide real-time estimates that correlate with traditional inflation data, offering a preview of where the economy is heading. This leads the way for traders to position themselves ahead of the curve.
Common CPI Analysis Mistakes
Use this section to make the CPI Analysis decision easier to compare in real life, not just on paper. Start with the reader's actual constraint, then separate must-have requirements from details that are merely nice to have. A practical choice should survive normal use, maintenance, timing, and budget. If a recommendation only works in an ideal situation, call that out plainly and give the reader a fallback path.
The simplest way to use this section is to write down the must-have criteria first, then compare each option against those criteria before weighing nice-to-have features.
Frequently asked: what to check next
Is higher CPI good or bad?
Higher CPI generally signals inflation, which erodes purchasing power and often pressures the Federal Reserve to raise interest rates. While moderate inflation is expected in a growing economy, sustained high CPI is typically viewed negatively by investors and consumers alike.
What was today's CPI report?
For the latest official figures, check the Bureau of Labor Statistics (BLS) directly. The most recent data shows the Chained Consumer Price Index for All Urban Consumers (C-CPI-U) increased 3.3 percent over the last 12 months. Market reactions depend on how these figures compare to consensus estimates.
What's the projected CPI for 2026?
Projections vary by institution, but current forecasts suggest a gradual cooling toward the Fed's 2% target. However, persistent service-sector inflation could keep headline numbers elevated. Consult the latest BLS releases and FRED data for the most accurate economic outlooks.
What time is CPI data coming out?
The BLS typically releases CPI data at 8:30 a.m. Eastern Time on the second Tuesday of the following month. This schedule is consistent, allowing traders and analysts to prepare for immediate market volatility upon publication.
Helpful gear
Use these product recommendations as a starting point, then choose the size, material, and price point that fit how you actually use the gear.


As an Amazon Associate, we may earn from qualifying purchases.
No comments yet. Be the first to share your thoughts!