What the CPI actually measures
The Consumer Price Index (CPI) is the most widely watched gauge of inflation, but it measures something very specific: the average change over time in the prices paid by urban consumers for a market basket of consumer goods and services [1]. Think of it as a receipt for everyday life. It tracks what you spend on food, housing, apparel, transportation, and medical care. It does not track stock prices, real estate values, or insurance premiums directly, nor does it measure your personal cost of living.
The Bureau of Labor Statistics (BLS) calculates this index by collecting price data for thousands of items across the United States. They assign weights to each category based on how much the average household spends on it. For example, housing carries a heavier weight than apparel because it takes up a larger portion of most budgets. This "basket" remains fixed for a period, allowing economists to compare price changes consistently over time. When the CPI rises, it means that same basket costs more than it did previously.
Note: The CPI tracks a fixed basket of goods and services. It is not a measure of personal spending habits or individual financial health.
Understanding this distinction is critical before integrating on-chain data. On-chain tools can reveal shifts in consumer behavior, such as changes in stablecoin usage or decentralized exchange volumes, which often correlate with inflation pressures. However, these tools do not replace the CPI; they complement it. The CPI tells you what prices are doing in the official economy, while on-chain metrics can show how people are reacting to those prices in real time.
Reading the official data release
The BLS releases the Consumer Price Index (CPI) on the second Tuesday of each month. This report is the primary benchmark for inflation, tracking how prices change for a fixed basket of goods and services that typical households buy. Understanding this report requires looking beyond the headline number to see what is actually driving price changes.
Headline vs. Core Inflation
The headline CPI includes all items, but it can be volatile because food and energy prices swing wildly with weather events, geopolitical conflicts, and supply chain disruptions. For a clearer view of underlying inflation trends, analysts focus on Core CPI, which excludes food and energy. While headline figures matter for immediate consumer budgets, Core CPI often provides a more stable signal for long-term monetary policy decisions.
Year-Over-Year Changes
The BLS reports inflation in two main ways: month-over-month and year-over-year (YoY). The month-over-month change shows short-term momentum, but it is noisy. The year-over-year figure compares current prices to the same month last year, smoothing out seasonal variations. This metric is the standard for comparing inflation across different economic cycles and is the primary figure cited in financial news.
Interpreting the Numbers
When you read the report, look for the "All Items" index and the "All Items Less Food and Energy" index. The BLS publishes detailed tables breaking down these indices by category, such as housing, transportation, and medical care. Housing, or "shelter," typically carries the heaviest weight in the basket, so its performance often dictates the overall trend. Use the BLS interactive tools to drill down into specific categories relevant to your portfolio or business model.
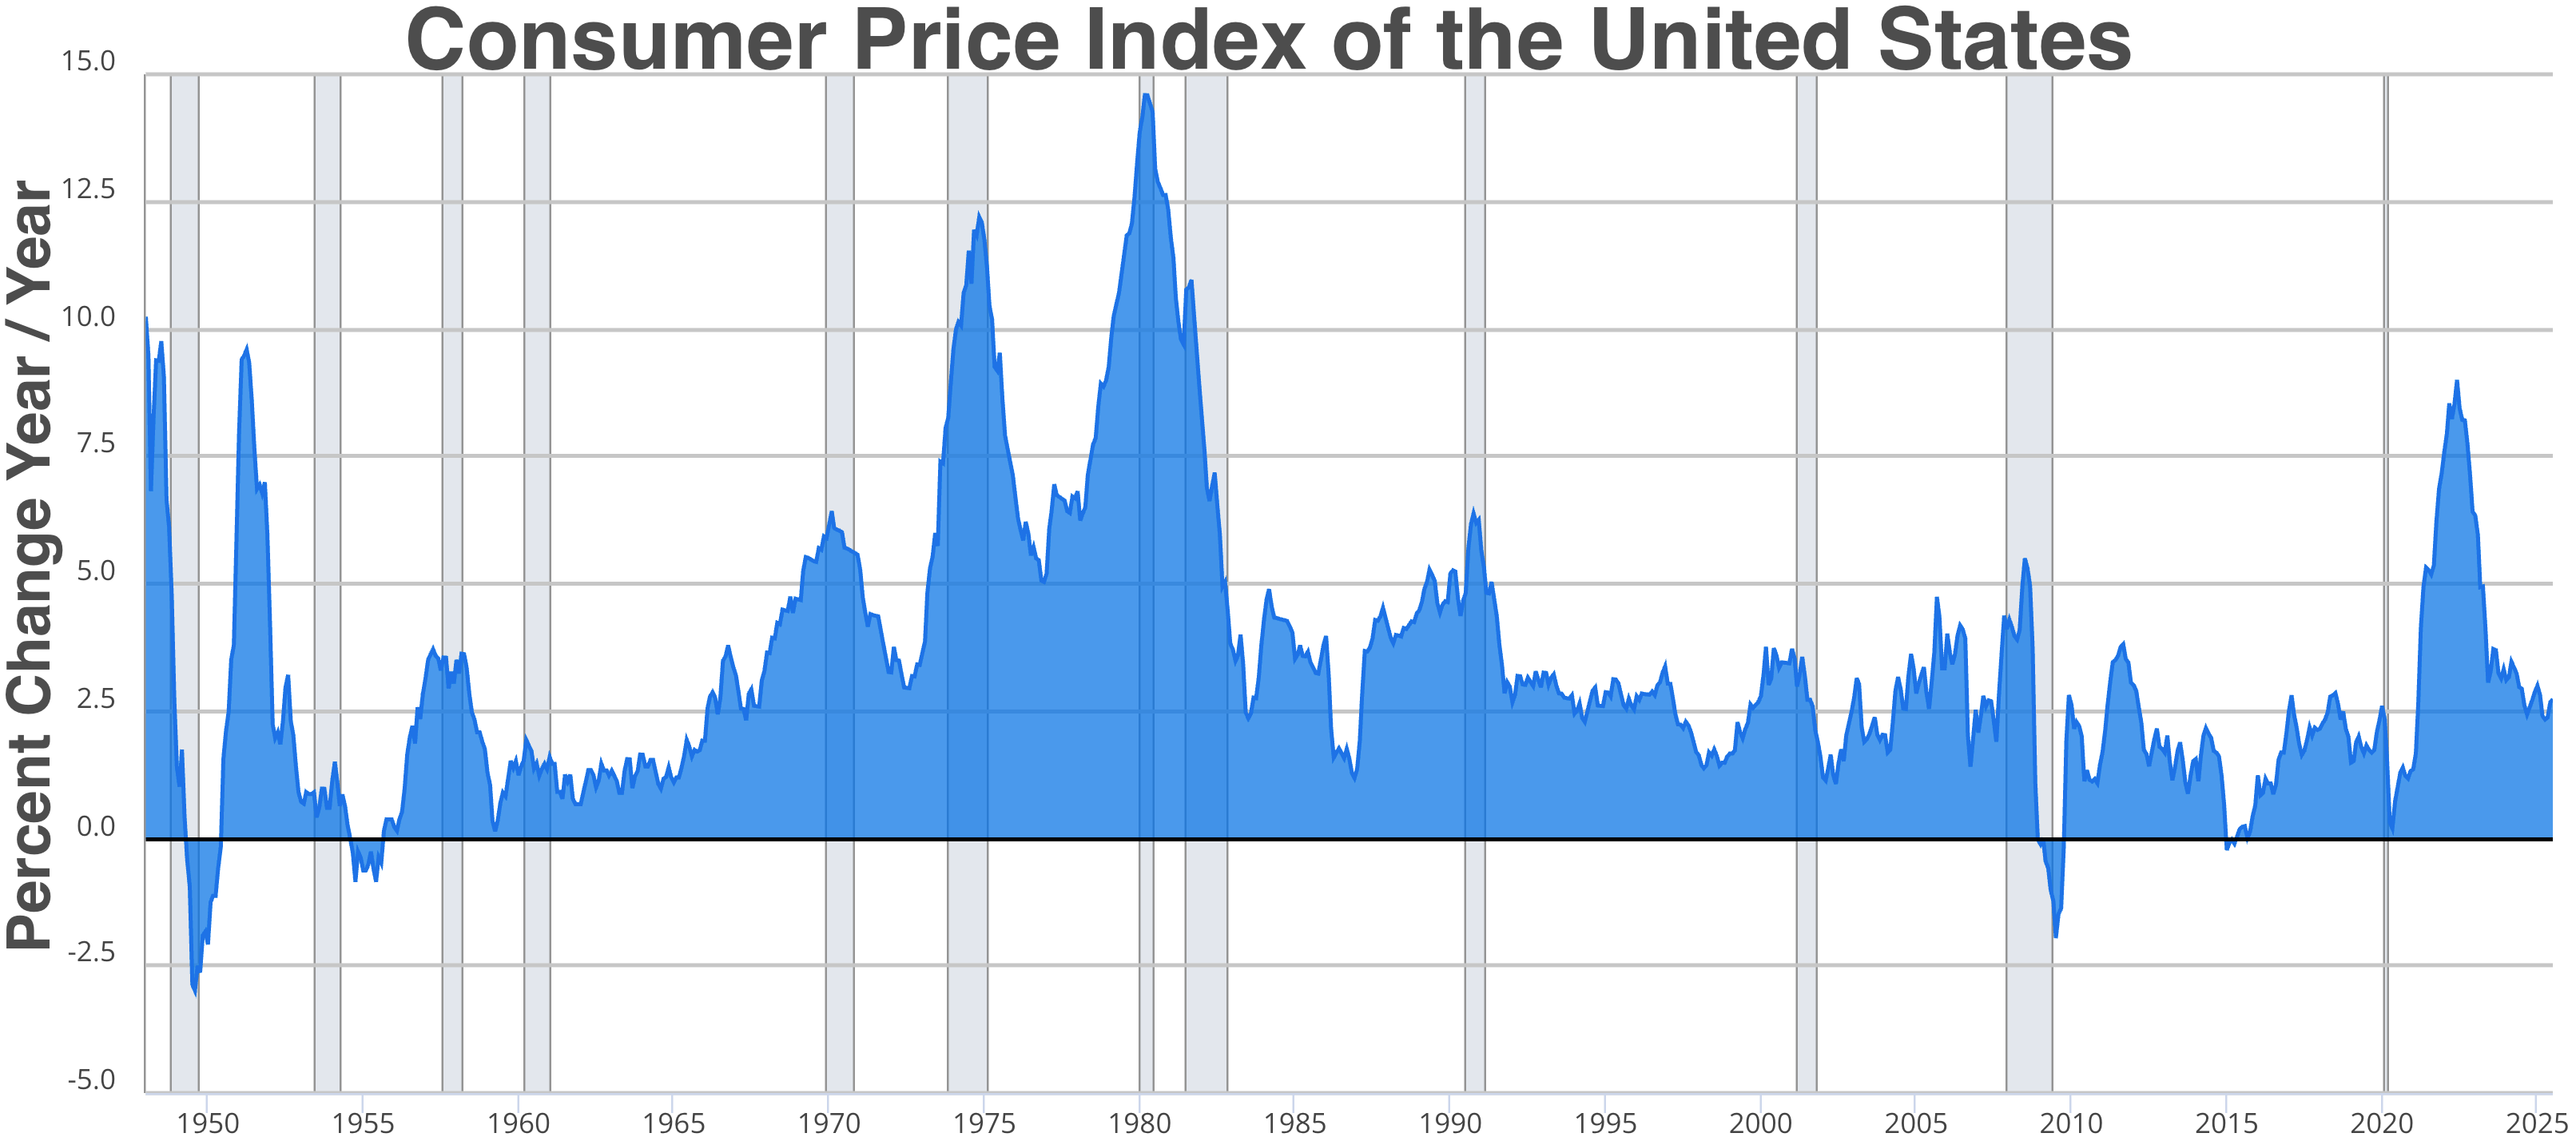
The chart above shows the historical trend of the CPI for All Urban Consumers (CPIAUCSL). Note the spikes during recent supply chain disruptions and the subsequent cooling period. This visual context helps you gauge whether current inflation is an anomaly or part of a longer trend.
On-chain signals for inflation
Traditional inflation tracking relies on the BLS to measure the average change in prices for a fixed "market basket" of goods and services. While the BLS provides the official baseline, its data is retrospective and aggregated on a monthly cycle. By the time the CPI report lands, the market has often already priced in the trend. On-chain data offers a different lens, providing near real-time visibility into global liquidity and asset pricing.
Blockchain infrastructure acts as a global ledger, recording transactions across borders and asset classes without the friction of traditional banking settlement times. This transparency allows analysts to monitor capital flows, stablecoin adoption, and decentralized finance (DeFi) activity as leading indicators. When liquidity expands in crypto markets, it often precedes broader economic shifts, offering a pulse on risk appetite that traditional surveys cannot match.
Chainlink oracles bridge this gap by feeding real-world data onto the blockchain. These networks aggregate data from multiple sources to ensure accuracy, providing smart contracts with reliable inputs for everything from commodity prices to currency exchange rates. By integrating Chainlink oracles, developers can build financial products that react to inflation metrics as they happen, rather than waiting for end-of-month reports. This creates a feedback loop where on-chain activity can reflect consumer behavior and institutional hedging strategies in real time.
To understand how these digital signals correlate with broader economic trends, it helps to look at the underlying price action of assets that serve as inflation hedges. Bitcoin, often viewed as "digital gold," frequently moves in tandem with macroeconomic liquidity events. Monitoring its price alongside traditional CPI releases can reveal how the crypto market anticipates or reacts to inflationary pressure.
Tools for accurate CPI analysis
Tracking the Consumer Price Index requires a mix of official government data and on-chain signals. The BLS publishes the raw numbers, but on-chain tools help you see how those numbers actually move markets.
Official data sources
Start with the primary sources. The BLS releases monthly CPI reports that define the basket of goods. For broader context, the IMF publishes a CPI manual that explains the methodology behind these calculations. These documents are free and essential for understanding what the index actually measures.
On-chain analytical frameworks
On-chain data provides a real-time layer that traditional CPI reports lack. Platforms like Glassnode or Nansen track stablecoin flows and exchange reserves. When inflation data drops, these tools show you if the market is reacting with immediate liquidity shifts or slow accumulation.

Essential reading and courses
To deepen your understanding, consider structured learning resources. The following books and courses cover inflation mechanics and financial analysis:


As an Amazon Associate, we may earn from qualifying purchases.
No comments yet. Be the first to share your thoughts!