What the CPI actually measures
In financial market research, "CPI" almost always refers to the Consumer Price Index. It is a statistical estimate that tracks changes in the price level of a weighted average market basket of consumer goods and services purchased by households. This metric serves as the primary gauge for inflation, reflecting how much money is needed today to buy the same standard of living available yesterday.
The Bureau of Labor Statistics (BLS) and the International Monetary Fund (IMF) maintain rigorous standards for calculating these indices. The BLS publishes the U.S. CPI, which adjusts for quality changes and new products to ensure the data reflects pure price movement rather than shifts in consumer behavior or product composition. The IMF’s CPI Manual provides the global framework, ensuring that compilers in developed and developing nations use consistent methodologies. This standardization allows for reliable cross-border comparisons of purchasing power and inflation trends.
Accurate measurement matters because the CPI influences everything from federal tax brackets to cost-of-living adjustments in social security. For market analysts, it is the baseline against which real returns, bond yields, and currency strength are evaluated. Misinterpreting the data or relying on unadjusted figures can lead to significant errors in portfolio positioning and economic forecasting.
Tracking real-time inflation data
Relying solely on monthly CPI releases from the Bureau of Labor Statistics leaves you with a rearview mirror. The official report is authoritative, but it arrives with a lag that can obscure immediate market shifts. To stay ahead, you need to monitor live inflation expectations and real-time pricing signals from bond markets, which react instantly to new data.
The TreasuryDirect TIPS/CPI data page provides the daily index ratios that link Treasuries to inflation. This data serves as a high-fidelity proxy for current inflation trends, offering granularity that monthly snapshots cannot match. By tracking these daily ratios, you can spot divergences between headline CPI and market-implied inflation expectations.
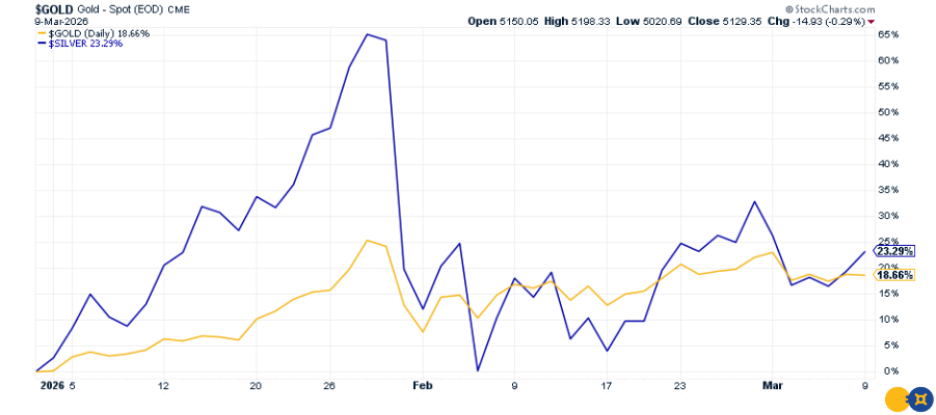
Use the following tools to visualize these live signals. The chart below tracks the performance of inflation-linked bonds, reflecting how the market prices future inflation risks in real time.
For a quick snapshot of the broader inflation-linked asset class, the price widget below shows current market pricing. This helps you gauge the immediate cost of hedging against inflation without waiting for the next BLS release.
Analyzing price trends with charts
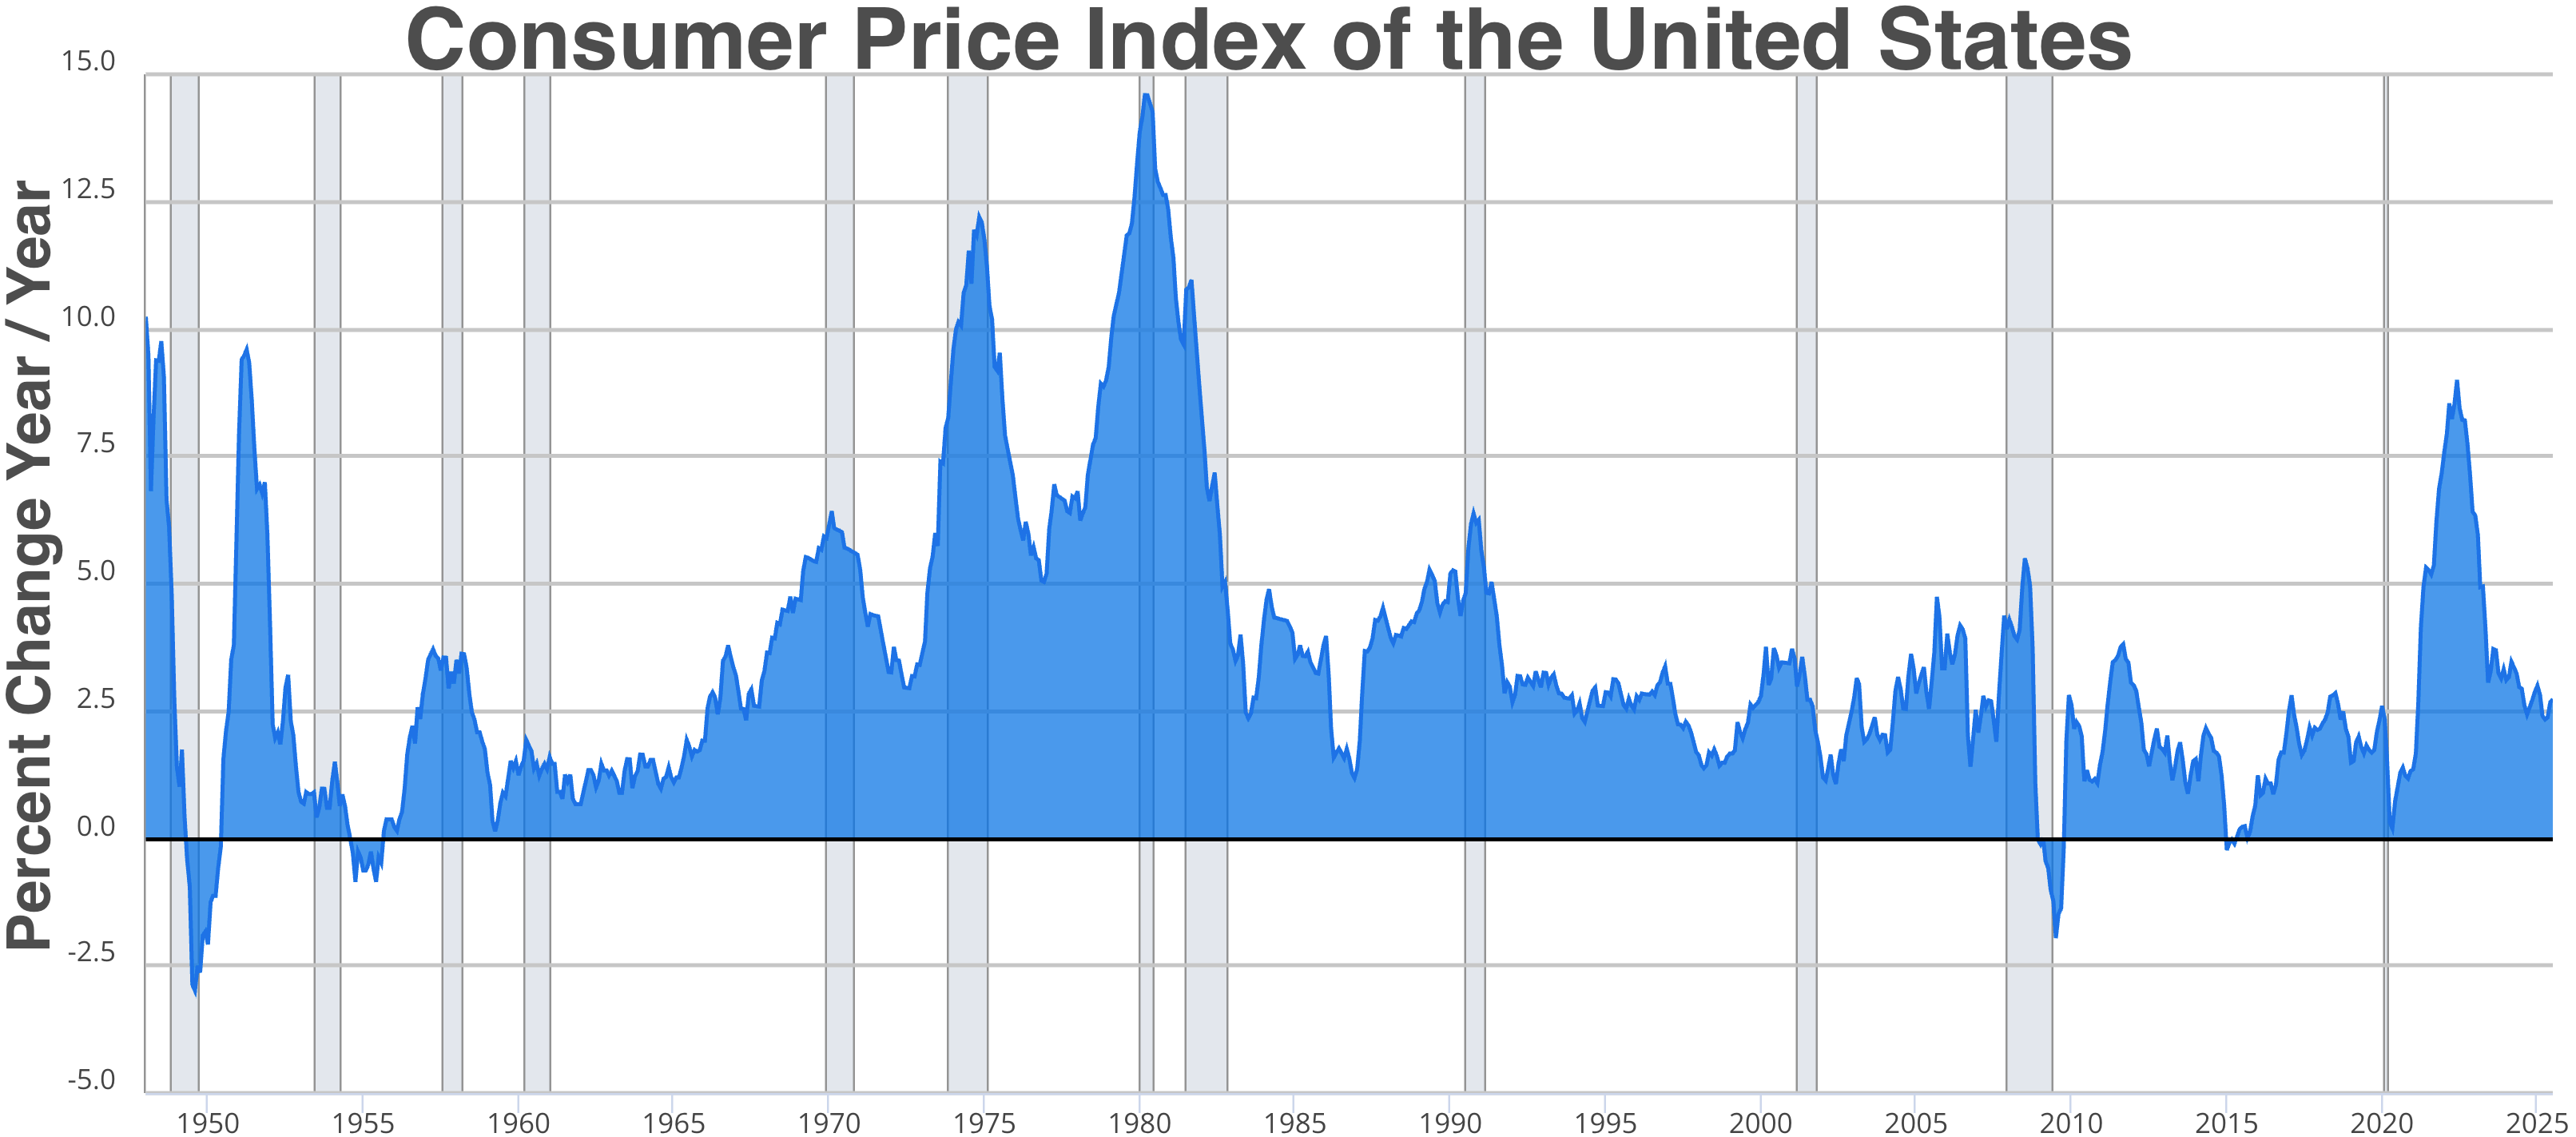
Raw CPI numbers tell you what happened last month. Charts tell you what is likely to happen next. By overlaying price data with technical indicators, you can spot momentum shifts and volatility spikes that simple percentage changes hide. This approach moves the analysis from backward-looking reporting to forward-looking strategy.
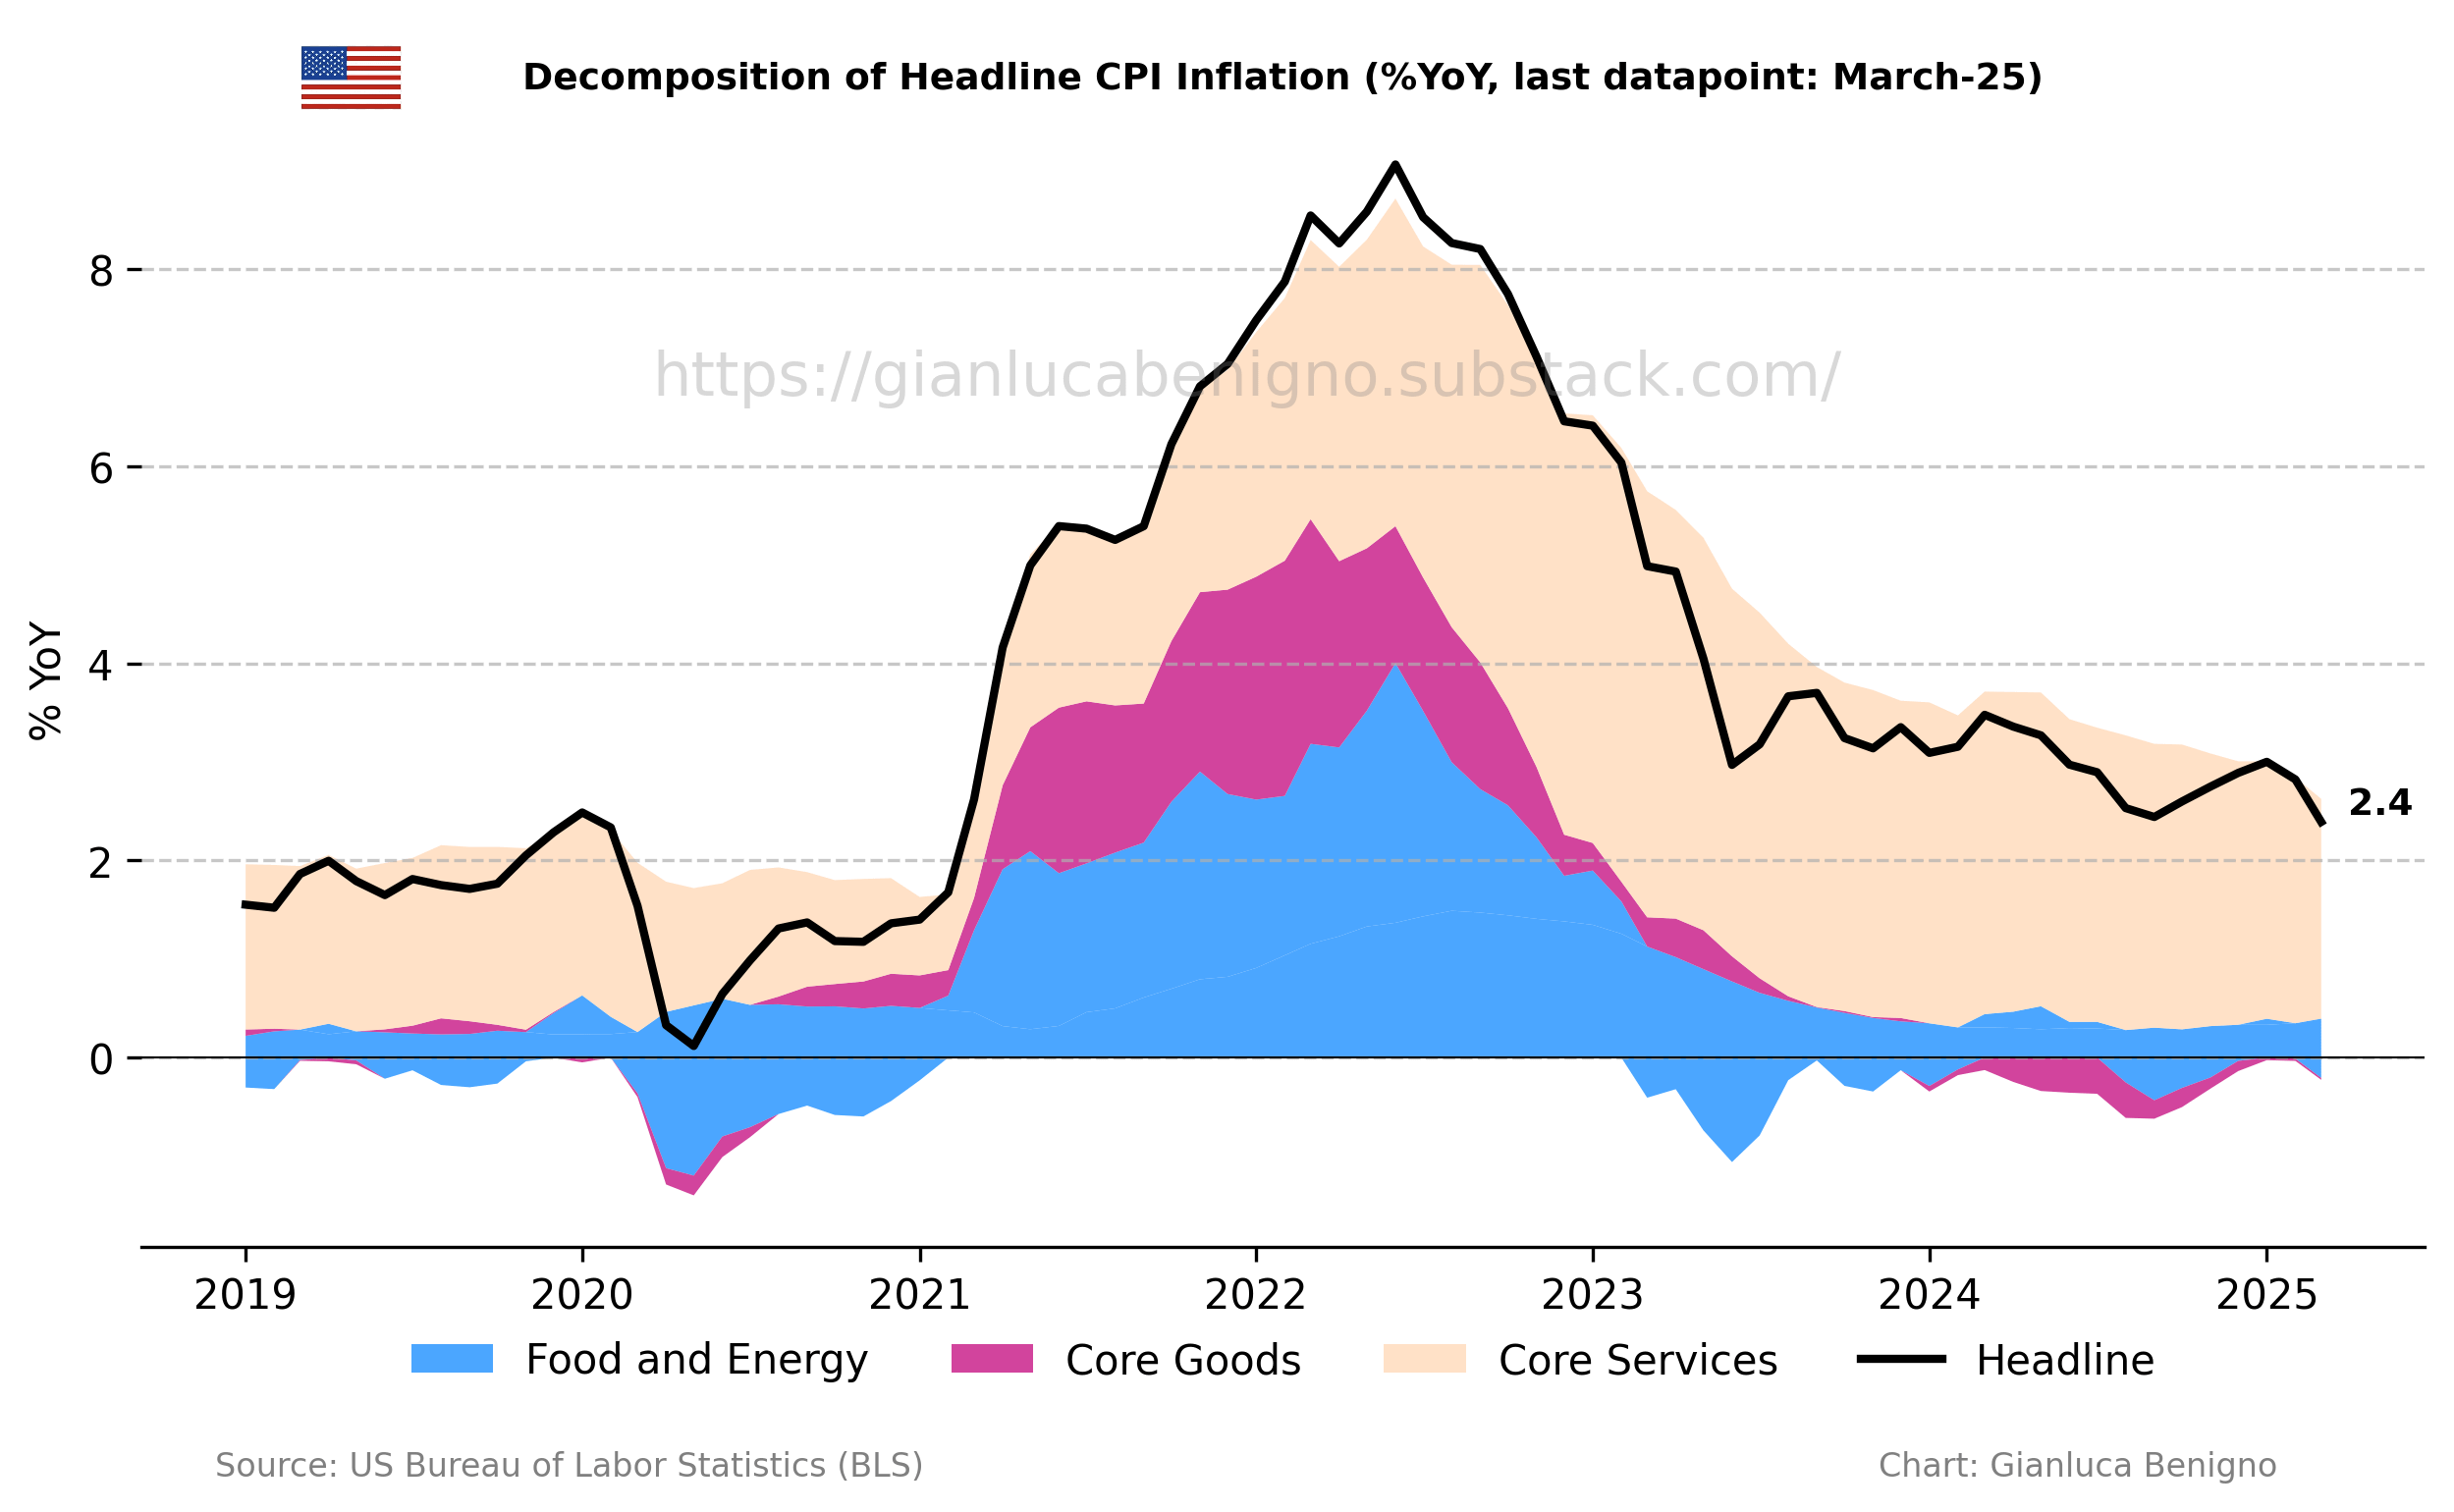
The Bureau of Labor Statistics provides the raw data, but the signal often lives in the patterns. Moving averages smooth out the noise of monthly fluctuations, revealing the underlying trend. When the CPI line crosses above its 12-month moving average, it signals accelerating inflation. Crossing below suggests cooling. These crossovers are not just mathematical artifacts; they represent shifts in consumer spending pressure and potential Federal Reserve responses.
Volatility is just as important as direction. A chart visualizes the range of price movement, helping you distinguish between a temporary blip and a structural break. High volatility in CPI data often precedes broader market corrections or sector rotations. By watching the standard deviation of price changes on a chart, you can gauge the stability of the inflation trend.
This visual method complements official reports from the IMF and BLS. While those sources provide the authoritative definitions and methodologies, charts provide the tactical edge. They allow you to see the data in context, identifying entry and exit points for investments tied to inflation expectations.

Comparing research methodologies
Choosing the right CPI data source depends on your specific analytical needs. While the U.S. Bureau of Labor Statistics (BLS) provides the definitive domestic benchmark, international standards and private trackers offer different lenses for global or real-time analysis.
The table below outlines the core distinctions between official government releases, international manual standards, and private sector inflation trackers. Use this framework to select the tool that best fits your research scope.
| Source | Scope | Frequency | Best For |
|---|---|---|---|
| BLS Official CPI | U.S. Domestic | Monthly | U.S. macroeconomic forecasting |
| IMF CPI Manual | Global Standards | Reference Framework | Cross-country methodology alignment |
| Private Inflation Trackers | Real-time/Granular | Daily/Weekly | Short-term market sentiment |
For domestic U.S. analysis, the BLS remains the primary authority. Their data is rigorously audited and forms the basis for most federal policy decisions. If you are modeling U.S. inflation trends, start with the official BLS releases to ensure your baseline is accurate.
When analyzing global markets or comparing inflation across borders, refer to the IMF’s Consumer Price Index Manual: Concepts and Methods. This framework ensures that CPI calculations meet international standards, allowing for consistent comparisons between developed and developing economies. It is less a data source and more a guide on how to interpret data correctly.
For traders needing immediate market signals, private sector trackers offer daily or weekly updates. These tools often incorporate high-frequency data like credit card transactions or web scraping. While they lack the long-term historical depth of official sources, they provide a pulse on current consumer behavior that official monthly reports cannot match.
Essential tools for CPI research
Rigorous CPI analysis requires more than raw data; it demands the right infrastructure to track, interpret, and contextualize inflation metrics. The tools listed below span official data sources, reference manuals, and analytical software that support professional-grade market research.
Official Data and Reference Standards
The Bureau of Labor Statistics (BLS) remains the primary source for U.S. CPI data. Their Consumer Price Index Overview provides the foundational indexes used to adjust income eligibility and tax brackets. For global context, the International Monetary Fund’s CPI Manual offers the standard concepts and methods for compiling indexes across developed and developing economies.
Software and Analysis Tools
Professional analysts rely on specialized software to handle the volume of price data. Tools like Bloomberg Terminal or Refinitiv Eikon provide real-time CPI feeds and historical datasets. For independent researchers, Python libraries such as pandas and statsmodels offer robust frameworks for calculating inflation adjustments and running regression analyses on price trends.
Recommended Reading
To deepen your understanding of CPI mechanics, consider these essential resources:

As an Amazon Associate, we may earn from qualifying purchases.
These tools form the backbone of any serious CPI research strategy. By combining official data with robust analytical software, you can ensure your inflation analysis is both accurate and actionable.
Building a robust CPI strategy
Implementing a CPI-based research strategy requires moving beyond simple headline numbers. You need a structured workflow that integrates official data sources with live market signals. This checklist ensures your analysis remains grounded in verified data while capturing real-time market sentiment.
Start every analysis with the Bureau of Labor Statistics (BLS) and the IMF CPI Manual. These sources provide the methodological backbone for understanding how inflation is calculated. Use their definitions for core vs. headline CPI to avoid misinterpreing temporary price spikes as structural trends.

Static historical data tells you what happened; live widgets show what the market expects. Embed a TechnicalChart for major inflation-linked assets or a PriceWidget for key commodity inputs. This bridges the gap between official statistics and current market pricing, giving you a real-time pulse on inflationary pressure.
Don't treat all price changes equally. Isolate core CPI (excluding food and energy) to identify underlying trends, while monitoring headline CPI for immediate consumer impact. This dual-lens approach prevents overreacting to volatile commodity swings while keeping an eye on the basket of goods that directly affects purchasing power.
National averages often mask local realities. Cross-reference national CPI figures with regional price indices and specific sectoral data (e.g., housing, healthcare). This granularity helps you identify where inflation is truly biting and where it is receding, allowing for more precise economic forecasting and risk assessment.
Inflation data is revised. Always note the release date and version of the BLS or IMF data you are using. Create a simple log of your data sources and any adjustments made for seasonality or base effects. This ensures your research is transparent, reproducible, and defensible when market conditions shift.
No comments yet. Be the first to share your thoughts!