What CPI Market Research Actually Means
If you search for "CPI," you will likely encounter two completely different definitions. In traditional market research, CPI stands for Cost Per Incidence—a metric used to calculate the cost of qualifying a single survey participant. This is a back-office efficiency metric for agencies.
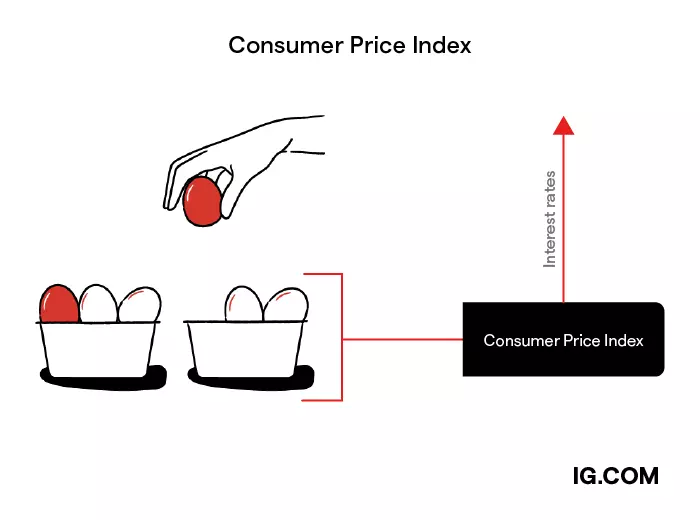
However, in the context of this guide, we are focusing on the Consumer Price Index. This is the primary gauge of inflation, tracking the average change over time in the prices paid by urban consumers for a market basket of consumer goods and services. The Bureau of Labor Statistics (BLS) calculates this index monthly, making it a critical input for economic analysis.
The ambiguity of the acronym can be confusing, but the distinction is vital. When we discuss CPI market research in web3, we are looking at how decentralized protocols can provide real-time, granular data that complements or challenges the lagging, aggregate data provided by traditional government agencies. By analyzing on-chain transaction volumes and token velocity, we can build a more immediate picture of economic activity than what appears in the monthly reports.
Why real-time cpi data matters for traders
The traditional Consumer Price Index is a lagging indicator. Published monthly by the BLS, it reflects price changes that occurred weeks or even months prior to the release date. For high-stakes market analysis, this latency is a structural vulnerability. By the time official data confirms inflation trends, institutional algorithms and high-frequency traders have already priced in expectations based on earlier signals. Waiting for the report is like driving by looking only in the rearview mirror.
Real-time CPI proxies, particularly those derived from on-chain data and alternative sources, offer a strategic edge by compressing this timeline. These tools track price movements in liquid assets and supply chain indicators daily, providing a continuous feed of inflation pressure rather than a monthly snapshot. In cpi market research, the ability to spot divergences between real-time inflation signals and official reports allows traders to anticipate central bank policy shifts before they become consensus.
This dynamic is especially critical in volatile markets where sentiment can swing on a single data point. When real-time inflation metrics rise faster than the official trajectory, it signals accelerating price pressures that may trigger aggressive monetary tightening. Conversely, a decoupling where real-time data cools while official data remains hot can indicate a temporary spike rather than a structural trend. Understanding this gap is essential for positioning portfolios ahead of major macroeconomic announcements.
The following chart illustrates the correlation between the official Consumer Price Index (CPIAUCSL) and broader market volatility. Traders use such visualizations to identify periods where real-time inflation proxies diverged from the official data, often preceding significant market corrections or rallies.
Relying solely on official releases leaves traders exposed to "surprise" volatility. Integrating real-time cpi market research tools into your workflow provides a more granular view of economic health, allowing for proactive rather than reactive decision-making. The goal is not to replace official data, which remains the gold standard for long-term trend confirmation, but to use real-time proxies to manage the noise between releases.
How Chainlink and Pyth feed inflation data
To make CPI Market Research actionable, you must separate must-have infrastructure from nice-to-have features. A practical choice should survive normal use, maintenance, timing, and budget constraints. If a recommendation only works in an ideal situation, call that out plainly and give the reader a fallback path.
The simplest way to evaluate these options is to write down your must-have criteria first, then compare each oracle network against those criteria before weighing secondary features.
Building a CPI Strategy with On-Chain Tools
On-chain analytics platforms now ingest official BLS data to create real-time inflation signals. This allows traders to move beyond lagging monthly reports and adjust positions as market expectations shift. For this type of cpi market research, the goal is to translate macroeconomic data into immediate liquidity flows.
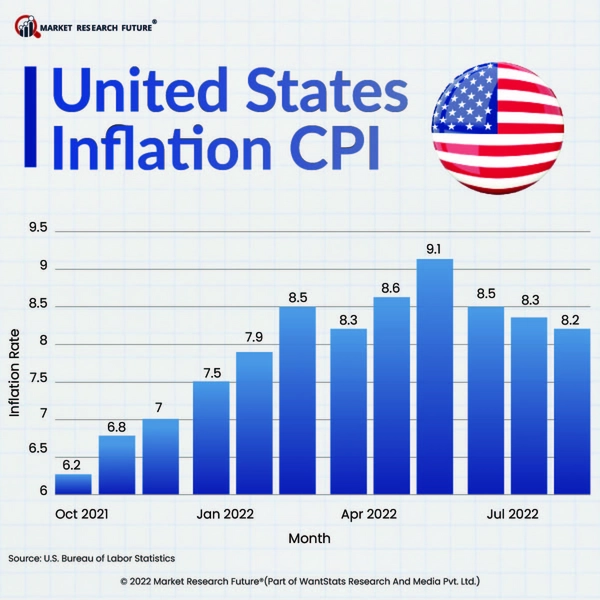
Traders often use these feeds to hedge against inflation spikes. When on-chain metrics show a divergence between CPI releases and stablecoin liquidity, it signals potential volatility. Adjusting leveraged positions during these windows helps mitigate risk when traditional markets react to the headline number.
Gold and TIPS serve as primary hedges in this strategy. By monitoring their price action alongside CPI data, you can gauge whether the market is pricing in persistent inflation or a cooling economy. This combination provides a concrete framework for managing exposure during high-stakes release periods.
Essential tools for cpi market research
Tracking inflation requires more than just the raw numbers from the BLS; it demands the right infrastructure to visualize and act on the data. For cpi market research, professionals rely on specialized dashboards and data terminals that aggregate price changes across a fixed basket of goods and services.
For rigorous analysis, Bloomberg Terminal and Refinitiv Eikon remain the industry standards. These platforms provide instant access to CPI components, allowing researchers to isolate specific categories like energy or food prices. The cost is high, but the depth of historical data and the ability to run complex economic models justify the expense for institutional researchers.
| Tool | Best For | Cost |
|---|---|---|
| Bloomberg Terminal | Institutional modeling | High |
| Refinitiv Eikon | Real-time data feeds | High |
| FRED API | Free academic access | Free |
For individual researchers or smaller teams, the Federal Reserve Economic Data (FRED) API offers a powerful, free alternative. It allows you to pull official BLS CPI data directly into Python or R scripts, enabling custom visualizations without the hefty subscription fee of professional terminals. This approach democratizes access to high-quality inflation data.
To keep a pulse on how inflation impacts broader markets, pairing your research with live market data is essential. A TechnicalChart for the S&P 500 or a PriceWidget for major commodities can help you correlate CPI spikes with market reactions in real time.
For those looking to deepen their understanding of macroeconomic trends through reading, the following resources are highly recommended for any serious researcher's library.


As an Amazon Associate, we may earn from qualifying purchases.
Common questions about cpi data feeds
Understanding CPI requires distinguishing between two very different definitions depending on your role. In market research, CPI stands for cost-per-incidence, a metric tracking the expense to find one qualified survey respondent. In macroeconomics, it refers to the Consumer Price Index, a government gauge of inflation that moves asset prices.
What is CPI in market research?
In the context of consumer surveys and focus groups, CPI measures efficiency. It is the cost per complete based on the qualifying rate of participants. If you pay $500 for a panel and only 10 people qualify, your cost-per-incidence is $50. This metric helps researchers budget for hard-to-reach demographics.
Is CPI data bullish or bearish?
For traders, the relationship is inverse to bond yields and often stocks. A higher-than-expected CPI print signals rising inflation, which typically pressures the Federal Reserve to keep interest rates high. This environment is generally bearish for growth stocks and speculative assets. Conversely, lower CPI data can be bullish, suggesting cooling inflation and potential rate cuts.
What does CPI mean for markets?
CPI is the primary barometer for economic health. It measures the average change in prices paid by consumers for a basket of goods and services. Because it is published monthly by the BLS, it serves as a key input for Federal Reserve policy decisions, directly influencing the dollar, bonds, and equity valuations.
What are the 4 types of CPI?
Analysts typically track four variations to gauge inflation depth:
- Headline CPI: The overall index including all items.
- Core CPI: Excludes volatile food and energy prices to show underlying trends.
- CPI-U: Measures spending for urban consumers (the standard benchmark).
- CPI-W: Tracks spending for wage earners and clerical workers, often used for COLA adjustments.
No comments yet. Be the first to share your thoughts!